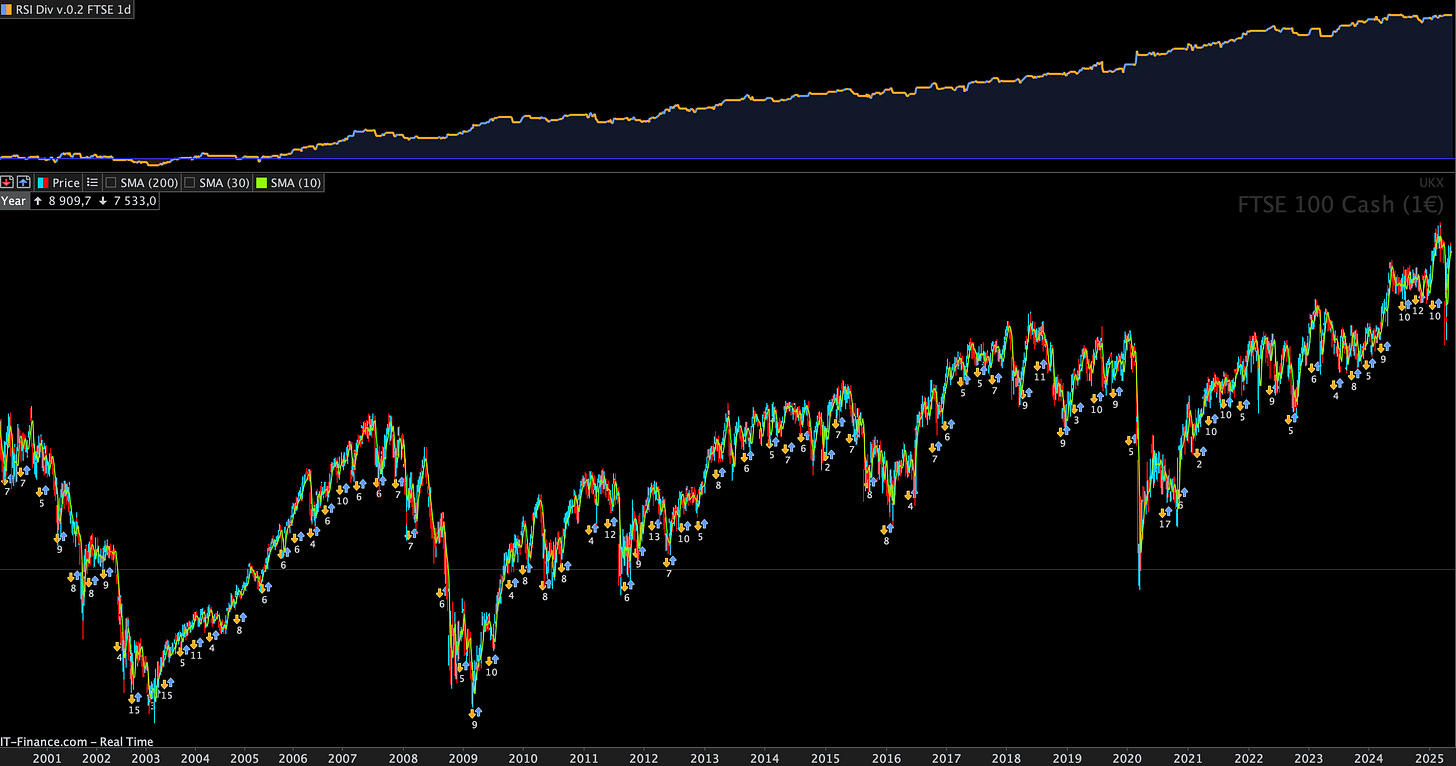
Strategy #3: Beat the FTSE 100 with 4 Simple Rules?
Discover a straightforward mean-reversion strategy that leverages RSI divergence to potentially profit from the FTSE 100's unique market dynamics.
Is Your US Strategy Failing on the FTSE? It's Not Just You.
The FTSE 100.
It's a titan of global finance, but it dances to a different tune than the US indices.
Many traders, including myself, have been humbled trying to apply Nasdaq-tested strategies to this beast. The FTSE's range-bound nature requires a different approach.
That's why I started exploring mean-reversion strategies tailored to the FTSE's personality.
The result? The RSI Divergence Strategy – a simple yet surprisingly effective system that I've been testing.
Why Simplicity Matters: The 4-Rule Approach
As you maybe know already, I'm a firm believer in keeping things simple.
This strategy uses just four rules: two for entry, one for exit, and a stop-loss.
No complicated indicators or advanced calculations.
The RSI Divergence indicator is very simple, you can find it in the ProRealCode forum.
Long Entry:
10-day Moving Average is higher today than yesterday.
A bullish RSI Divergence signal appears (using ProRealCode's indicator with settings [3, 40, 70, 20]).
Short Entry:
40-day Moving Average is lower today than yesterday.
A bearish RSI Divergence signal appears (using ProRealCode's indicator with settings [3, 20, 70, 20]).
Exit (Long or Short):
An opposing RSI Divergence signal appears. This means long exits will be a -1 and short exits will be a 1 on the RSI Divergence indicator.
Stop-Loss:
5% stop-loss for long positions.
2.5% stop-loss for short positions.
Backtesting the Strategy: What the Numbers Say
Of course, any strategy is just theory until it faces historical data.
Here's a summary of my backtesting setup and results:
Market: FTSE100 (FTSE)
Contract: ATR Based Dynamic Sizing
Broker: IG (simulated)
Testing Environment: ProRealtime 12
Timeframe: Daily
Time zone: CET
Backtest Period: Jan 2000-May 2025 (Out-of-sample since 2021-01-01)
Starting Capital: 10,000 €
Fees/Spreads: 2 Point spread included
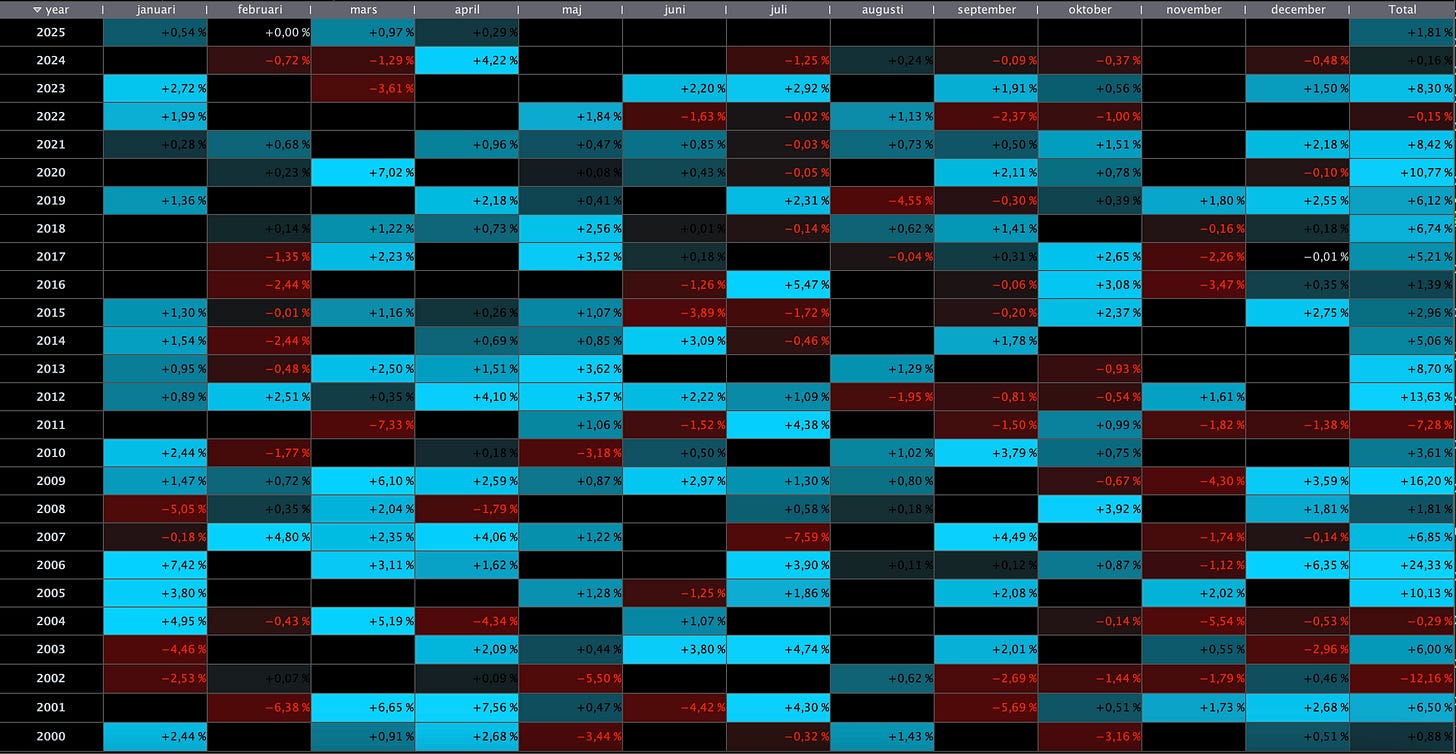
And the results?
Total gain: 25,460 €
Average gain per trade: 86.31 €
Total trades: 295
Winners: 196
Losers: 109
Winrate: 63%
Max drawdown: –2064 €
Risk/reward ratio: 1.12
Total time in the market: 35.45%
Average time in the market: 7 days, 21 hours
CAGR (10,000 € starting capital): 4.99%
Also, I find the short side to be particularly strong in this strategy:
Disclaimer: Past performance is not indicative of future results. This strategy is presented for informational and educational purposes only.
ProRealTime Code
For those of you who use ProRealTime, here's the code to get you started:
//----------------------------------------------------------------------
// Concept:   RSI Divergence (v.0.2 = RSI div for both entry and exit)
// Market:    FTSE
// Direction: Long and short
// Timeframe: Daily
// Timezone:  CET
// Versions:  v.0.1 | Algomatictrading.com | 2024-03-03 (OOS since: 2021-01-01)
//----------------------------------------------------------------------
defparam preloadbars = 5000
defparam cumulateorders = false

// POSITION MANAGEMENT
//------------------------------
timeframe (daily)

// Variables
atr = AverageTrueRange[39]             // ATR

//Dynamic Position Sizing
// User Inputs
riskPercent = 1          // Risk percentage for position sizing
portfolioSize = 20000     // Default portfolio size
// ATR calculation period

contractsToTrade = 1       // Number of contracts to trade

// Position Sizing Calculation
portfolioEquity = Max(PortfolioEquity, portfolioSize) // Use real equity or default portfolio size
contractsToTrade = (riskPercent / 100) * portfolioEquity / (atr * PointValue)
timeframe (default)

// RISK MANAGEMENT
//--------------------------
once sll = 5
once sls = 2.5

// INDICATORS
//---------------------------
ma1 = average[10,4]
ma2 = average[40,5]

// TRADING CONDITIONS
//---------------------------
// Long - Enter
// ------------------
cl = ma1 > ma1[1]
cl = cl and divergencersi[3,40,70,20] = 1

// Long - Exit
// ------------------
clx = divergencersi[3,40,70,20] = -1

// Short - Enter
// ------------------
cs = ma2 < ma2[1]
cs = cs and divergencersi[3,40,70,20] = -1

// Short - Exit
// ------------------
csx = divergencersi[3,40,70,20] = 1

// TRADING ACTION
//--------------------------------
// Enter
// ------------------
if cl then
buy contractsToTrade contract at market
set stop %loss sll
elsif cs then
sellshort contractsToTrade contract at market
set stop %loss sls
endif

// Exit
// ------------------
if longonmarket and clx then
sell at market
elsif shortonmarket and csx then
exitshort at market
endif
Important Considerations and Next Steps
This is a concept, not a ready-to-deploy system. Treat this as a starting point for your own research and development.
Adapt the code to your platform. If you're not using ProRealTime, you'll need to translate the code. ChatGPT can be helpful for this.
Account for fees and slippage. The backtest results above include spreads, but there could be other fees, so your live results can be different.
Test and validate the strategy. Don't risk real capital until you're confident in your understanding and implementation.
Finally…
The RSI Divergence Strategy offers a simple, rules-based approach to trading the FTSE 100. While backtesting shows promise, remember that real-world trading involves complexities not captured in historical data.
Now, it's your turn to take this concept, refine it, and see if it can find a place in your trading arsenal.
What do you think? Have you had success with mean-reversion strategies on the FTSE? Share your thoughts in the comments below!
Want more strategy breakdowns and trading ideas? Subscribe to my newsletter!
Disclaimer: I am not a financial advisor. This article is for informational and educational purposes only. Trading involves risk, and you can lose money. Always do your own research.


This strategy does not even cover funding charges