


Strategy #6: My take on Larry Connors 2RSI System + Bonus Strategy
Discover a simple, proven system that transformed a well-known indicator into a high-win-rate strategy, letting you profit from market pullbacks with minimal effort.

A way to consistently profit from market movements without staring at the charts, the sleepless nights, or the fear of missing out?
This isn't about magical indicators or complex algorithms.
It's about simple, yet incredibly powerful strategies built on a well-known principle: capitalizing on high-probability bounces within confirmed uptrends. This strategy, which I personally use in my multi-strategy portfolio, is designed for the modern trader who values simplicity, robustness, and a high win rate.
The Problem: Chasing Without a Plan
Most retail traders make one critical mistake…
They chase performance.
They buy into hype, react to news, and jump into trades when everything looks "good," often after the significant move has already happened. This leads to:
Emotional Decision-Making: Fear of missing out (FOMO) and greed drive poor entry and exit points.
Low Win Rates: Buying into overextended assets often leads to immediate pullbacks, resulting in losses.
Lack of Edge: Trading without a defined, backtested edge is basically gambling.
You’re missing out on the consistent profits that come from a disciplined, rules-based approach.
It doesn’t have to be this way…
Click here to get my strategies now on AlgomaticTrading.com!
The Strategy
This rules-based, long-only system, inspired by Larry Connors’ renowned 2-period RSI research, seeks to capture high-probability bounces inside confirmed uptrends while keeping the mechanics simple. It's an end-of-day strategy, meaning no intraday activity! You can set it, forget it, and let the system do the heavy lifting.

Here’s an overview:
Identify an Uptrend: We only trade in strong, confirmed uptrends to ensure we're aligning with the dominant market force.
Wait for a Pullback: Instead of chasing, we wait for a temporary price dip within that uptrend. This is where the opportunity lies.
Enter on "Oversold" Conditions: Using an indicator, we pinpoint when a pullback has reached an extreme, indicating a high probability of a bounce.
Exit on Bounce Confirmation: We exit when the market confirms the bounce, locking in profits.
Dynamic Position Sizing: Cleverly adjusts your trade size to market volatility – bigger positions in calm markets, reduced risk in volatile ones.


Methodology & Backtest Setup: Tested for Over 25 Years
To truly embrace a strategy, you need to trust it.
My approach leaves no room for guesswork. This strategy has been live-traded since 2023 with real capital, and backtested across more than 25 years of historical data, dating back to 2000. The OOS is since 2017.
Market: Nasdaq 100 (Tested on CFD & Futures) – a liquid, trending market.
Timeframe: Daily candles – ideal for swing trading and reducing noise.
Direction: Long only – profiting from rising markets.
Key Filters & Parameters:
Trend Filter: Price must be above a specific moving average.
Entry Signal: Utilizes a highly sensitive RSI (Short-period).
Exit Signal: Specific indicator to confirm the bounce.
Dynamic Position Sizing: Adjustable risk percentage tied to market volatility (ATR).
The goal here is transparency and replicability. Every rule, every parameter, has been defined and tested to build a robust system.
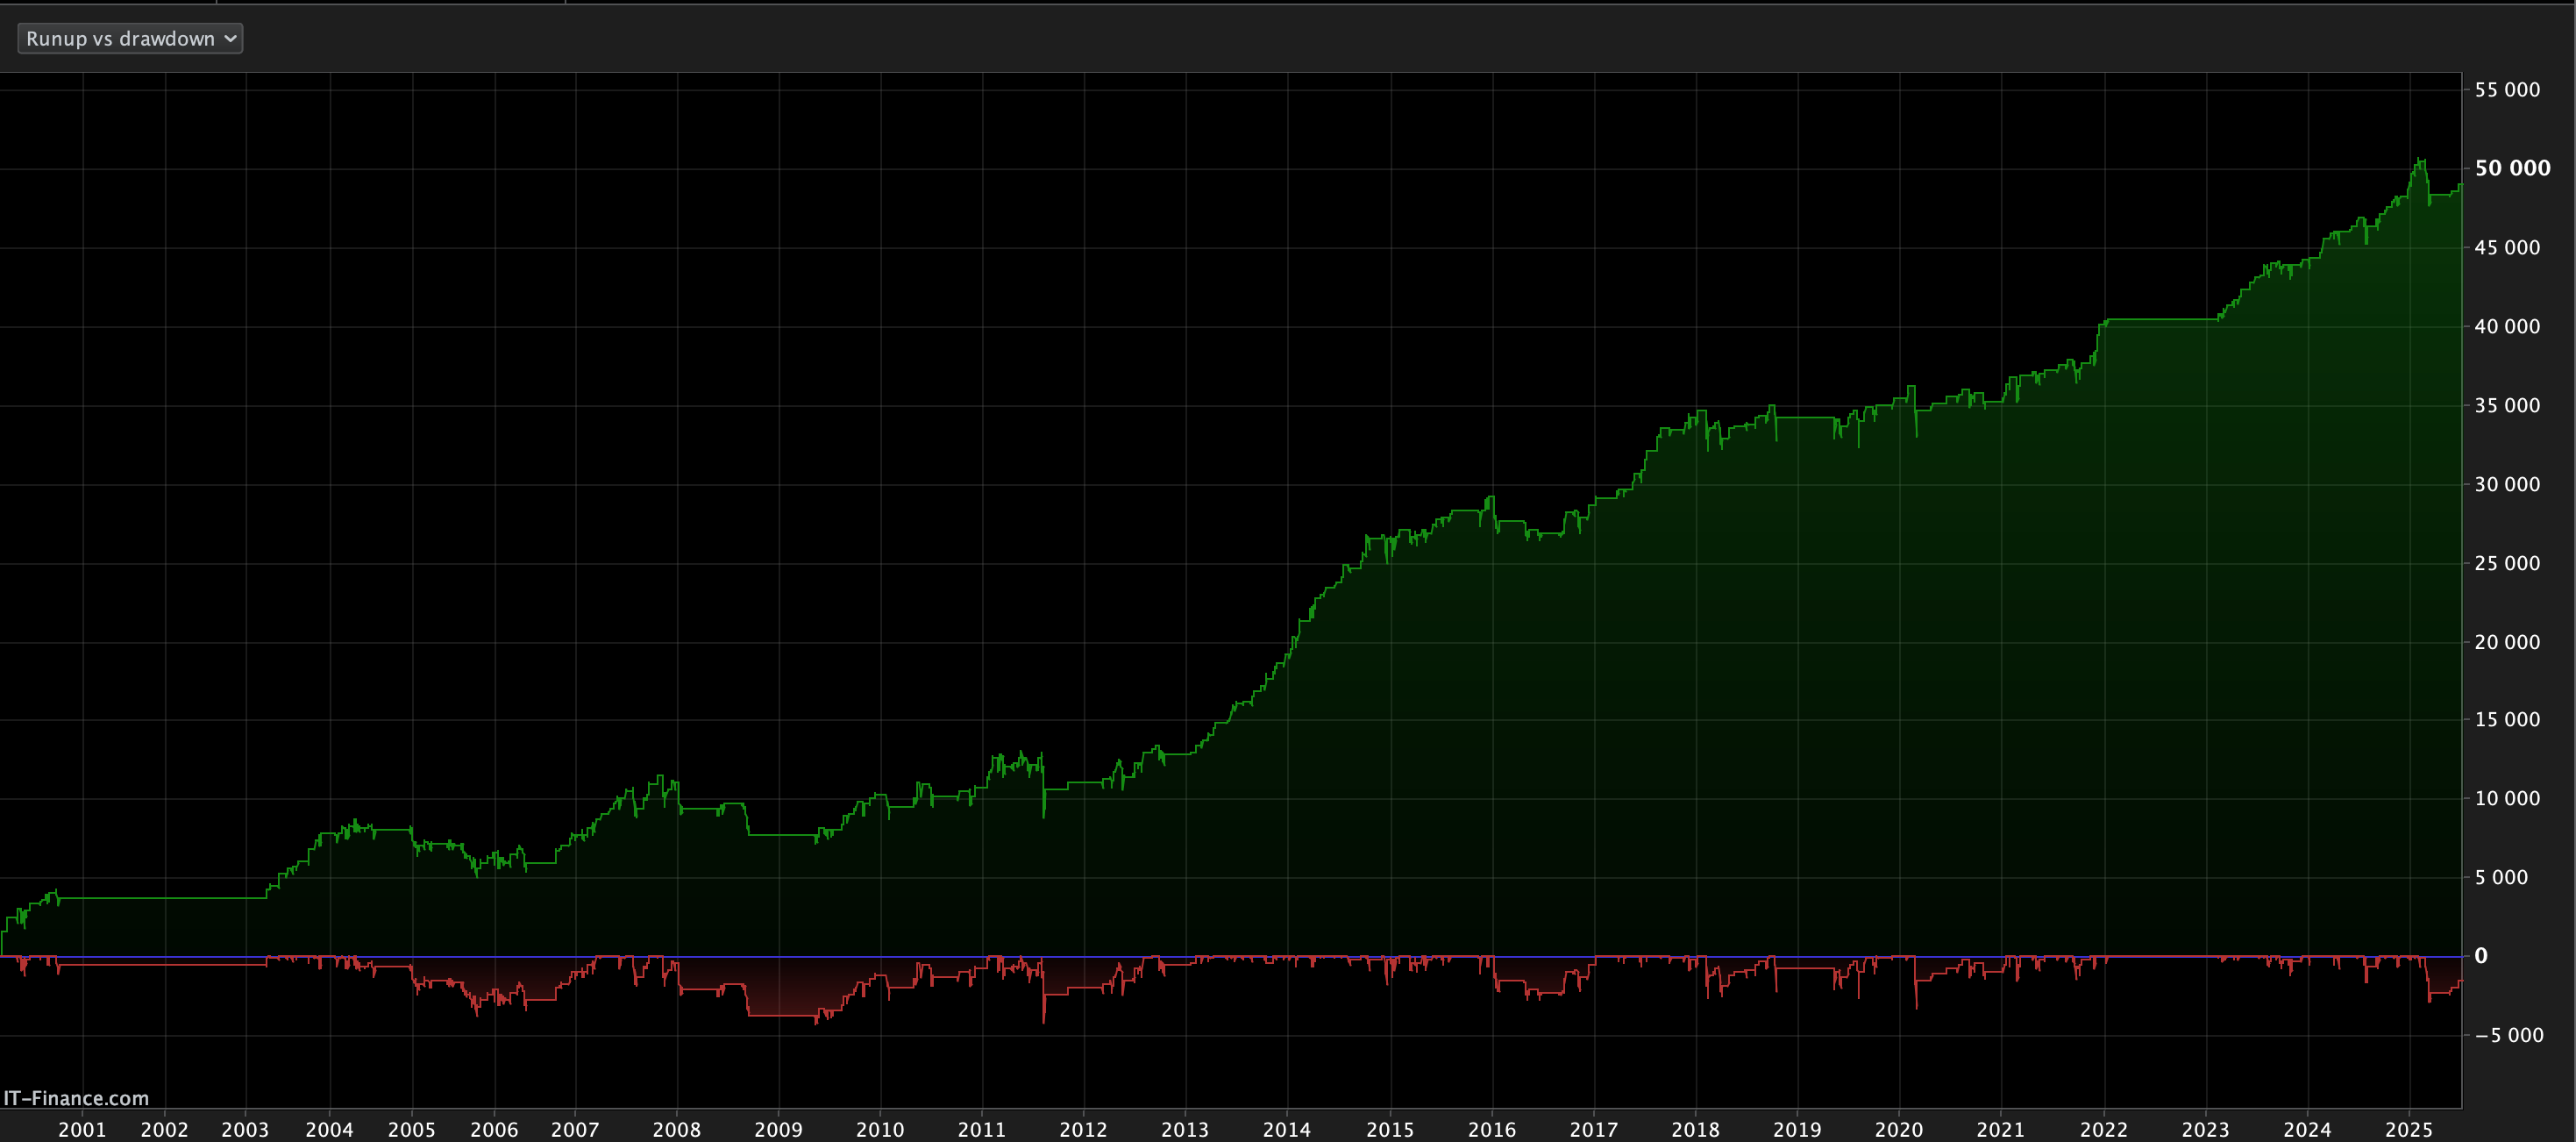
Results & Metrics: Consistent Gains, Controlled Risk
Here's how this simple strategy performed over a 25-year backtest (2000-2025):

CAGR (Compound Annual Growth Rate): 4.88%
Max Drawdown: 13.64%
Win Rate: 73.94%
Gain/Loss Ratio: 2.38
Trades per Year: 11
3 Point Spread included
What if we combine this with my version of the simple 3 Down, 3 Up strategy?

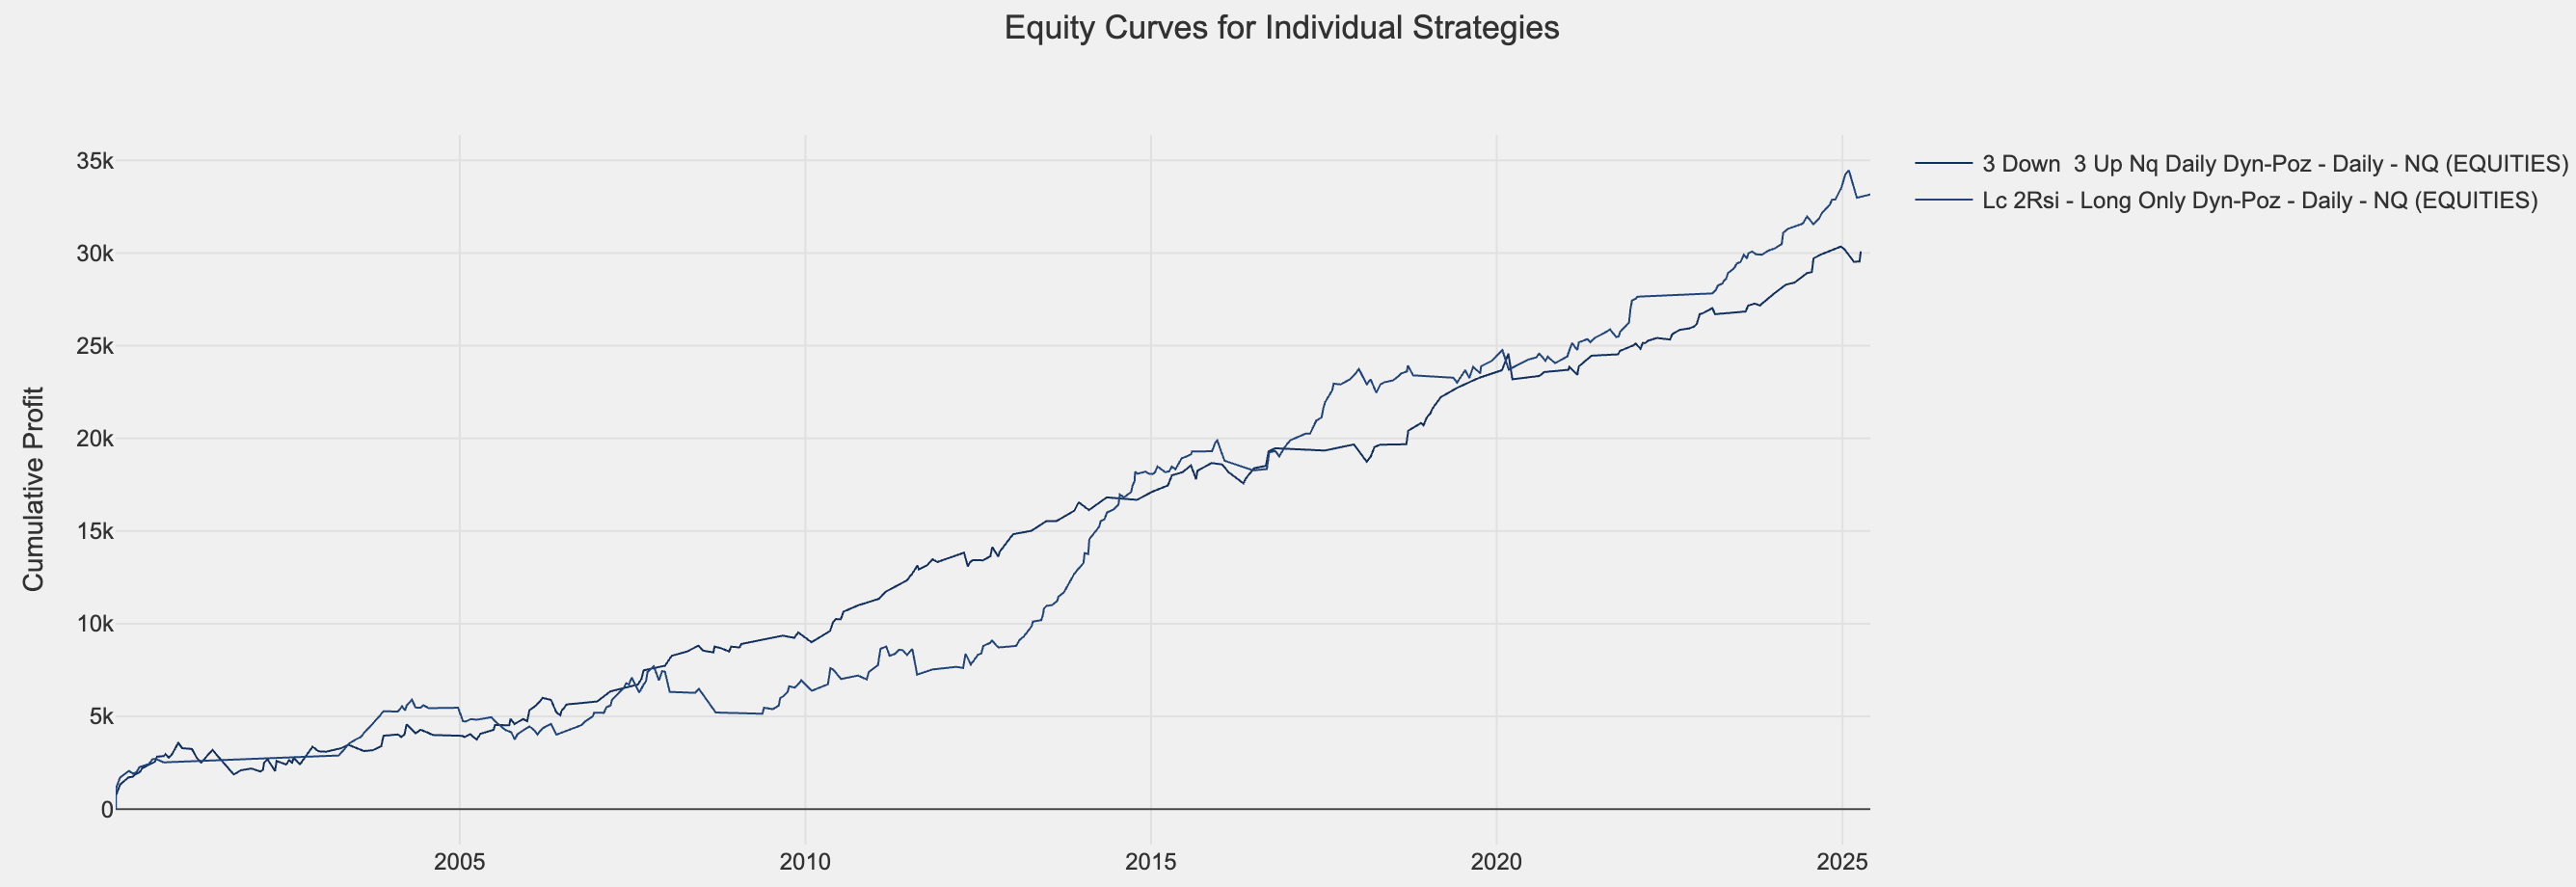
With a starting capital of 10.000€ we get around 16% Max drawdown and a CAGR of 8,2% since 2000.
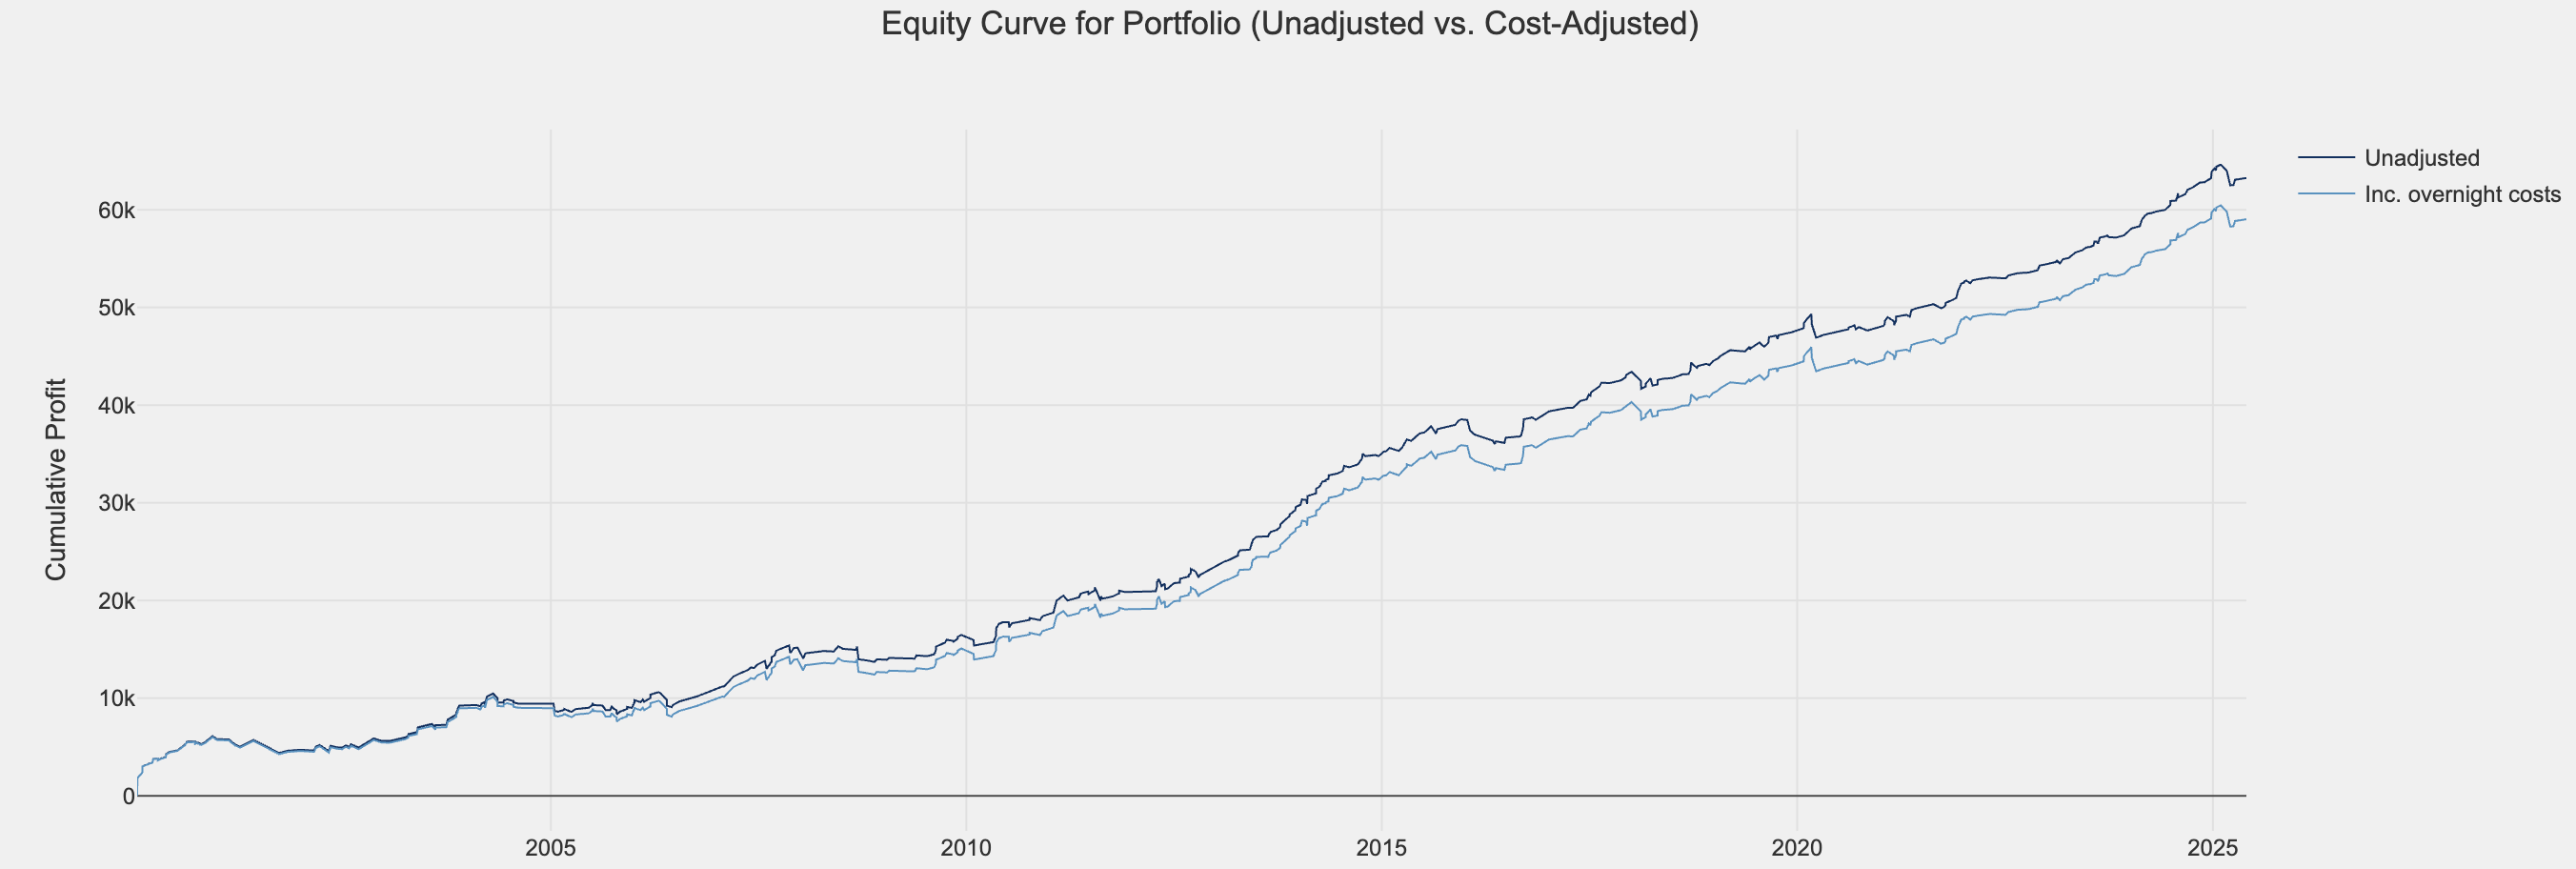
These two strategies combined has 29,8% time in the market and a max DD duration of 779 days. While these stats might not seem incredible this is just a simple combination of two quite similar strategies, nothing fancy at all. Imagine what you can achieve if you combine other type of strategies with these two.
If you are missing mean-reversion strategies in your portfolio these two could be good candidates.
Click here to get both strategies now on AlgomaticTrading.com!
Why It Works: The Synergy of Trend and Reversion
This strategy isn't just a collection of rules, it leverages several powerful market dynamics:
Momentum with Mean Reversion: The core idea is to combine trend-following (only trading in uptrends) with mean reversion (buying oversold pullbacks). This creates a powerful synergy: you're trading with the larger market force, but entering at statistically favorable prices.
Behavioral Edge: Markets often overreact. When a leading stock or index pulls back sharply within an uptrend, it’s often an emotional overreaction by market participants. This strategy exploits that temporary panic, buying when others are fearful.
Simplicity Bias: The simplicity of the rules reduces complexity and over-optimization. Complex systems often break down in real-world trading, but simple, robust strategies tend to endure.
Built-in Risk Control: The Dynamic Position Sizing mechanism is crucial. By automatically adjusting trade size based on market volatility (measured by Average True Range - ATR), it scales up your exposure when the market is calm and cuts back when volatility is high, providing an intelligent layer of risk management without manual intervention. This helps protect your capital during choppy periods and maximizes gains during smoother ones.
This fully rules-based approach ensures objectivity and eliminates emotional and discretionary decisions. While I've given you a conceptual overview, the exact parameters and implementation details are what make this strategy uniquely effective.
Variations & Robustness Tests: Beyond the Headlines
One of the cornerstones of a truly robust strategy is its ability to perform well under various conditions. While our core strategy is solid, exploring variations helps understand its resilience:
Sensitivity to Key Parameters: How does adjusting the sensitivity of the key indicators impact performance?
Trend Filter Alternatives: Could different trend filters (e.g., ADX for strength confirmation) enhance the strategy in specific market regimes?
Market Adaptability: How does its performance differ when applied to other instruments even individual stocks within the QQQ?
These types of tests help avoid curve-fitting and build confidence that the strategy's edge isn't just a fluke of specific parameters. The goal is to build a system that works across various different conditions.
Takeaways & Next Steps: Your Path to Trading Success
This strategy offers a robust blueprint for consistent, low-stress trading:
Simplicity is Power: Complex does not equal profitable. This strategy proves that clear, concise rules can deliver exceptional results.
Patience Pays: Waiting for high-probability setups (pullbacks within trends) drastically improves your win rate and reduces emotional trading.
Risk Management is Non-Negotiable: Dynamic position sizing is a game-changer, automatically adapting your risk to market conditions.
Trend is Your Friend (Even on Pullbacks): Always align with the dominant market trend, even when buying dips.
Backtesting Builds Trust: Over 25 years of robust historical data provides the confidence to execute this strategy.
Now, you have a choice. You can try to reverse-engineer this on your own, spending countless hours on the work. Or, you can fast-track the process.
Ready to unlock this strategy for your own portfolio?
While this article has laid out the blueprint, the exact parameters, specific code for automation, and detailed implementation guide for the "LC 2RSI Daily Trend-Pullback Strategy + 3 Down, 3 Up strategy" are waiting for you.
Click here to get both strategies now on AlgomaticTrading.com!
This is the exact strategies I trade in my multi-strategy portfolio, and it's backtested for over 25 years and 2+ years traded live.
what tools are you using for backtesting here?