
12 Essential Entries for Mean-Reversion Strategies
How to Enter the Market with the Odds in Your Favor

Finding the right entry point is crucial for the success of any mean-reversion strategy. Entering a trade when the odds are in your favor can significantly enhance your overall profitability. Mean-reversion strategies aim to capitalize on the tendency of prices to revert to their average over time after deviating significantly.
Sometimes creating algos is like speaking a language, the more words and vocabulary you know in a language the easier it is to express yourself, the same goes with creating a strategy.
Let’s say you want to test an idea where the setup is to identify oversold levels, if you know multiple ways to identify oversold levels, you can easier put your idea into code and also create a wider variety of strategies.
In this post, I will walk you through 12 essential entry strategies for mean-reversion trades. I created this post as a collection of different signals to be able to create more variety in my strategies and I think you could find this useful as well.
Understanding Mean-Reversion
Before diving into the entry points, it's essential to understand the basic principle. Mean-reversion strategies is based on the idea that when an asset's price moves further from it’s average, the higher the probability of it returning (reverting) to that average. Identifying "oversold" or "overbought" conditions is key.
Important Considerations
Backtesting: Always backtest these entries using historical data to understand their performance in different market conditions. Tools like ProRealTime or TradingView are excellent for this. Be wary of curve-fitting! Keep your strategies simple with few parameters to avoid this trap.
Risk Management: Implement robust risk management. Use dynamic position sizing (ATR based sizing or volatility targeting) to manage your risk effectively. Never risk more than a small percentage of your capital on any single trade.
Confirmation: Don't rely solely on one signal. Use confluence, look for multiple signals to increase the probability of a successful trade.
The 12 Essential Entries
Here are 12 entry strategies that is based on some well-known indicators and price action concepts:
IBS (Internal Bar Strength) Crosses Under 0.1
Entry: When the Internal Bar Strength (IBS) indicator drops below 0.1, it could suggest an oversold condition.
Explanation: IBS measures where the close is in relation to the high and low of the current bar. A low IBS indicates the price closed near the low of the bar, suggesting strong selling pressure that may be exhausted. This setup indicates a strong likelihood of a price rebound.
RSI2 (2-day Relative Strength Index) Crosses Under 10
Entry: When the 2-day Relative Strength Index (RSI) falls below 10, indicating the asset is oversold.
Explanation: RSI measures the magnitude of recent price changes to evaluate overbought or oversold conditions. A 2-day RSI is very sensitive to short-term price fluctuations, making it ideal for spotting quick reversals. This entry helps capture potential upward movements as the market corrects itself. A RSI 2 under 10 occurs frequently but can be a good level to start building confluences.

MACD Histogram Turns Positive
Entry: When the MACD histogram turns positive.
Explanation: The MACD (Moving Average Convergence Divergence) identifies changes in momentum. A positive histogram suggests that downward momentum is decreasing and an upward reversal may be on its way.

Stochastic Oscillator Below 20
Entry: When the Stochastic Oscillator drops below 20, could signal that the asset is oversold.
Explanation: The Stochastic Oscillator compares an asset’s closing price to its price range over a certain period. A value below 20 suggests the price is trading at the lower end of its recent range. This condition often precedes a reversal to the mean.
Low Hits Lower Bollinger Band
Entry: When the low price hits or falls below the lower Bollinger Band, indicating the asset is trading at the lower end of its volatility range.
Explanation: Bollinger Bands measure volatility around a moving average. When the price touches the lower band, it suggests the price has moved significantly below its average, increasing the likelihood of a rebound. This signal could suggest a potential price rebound.
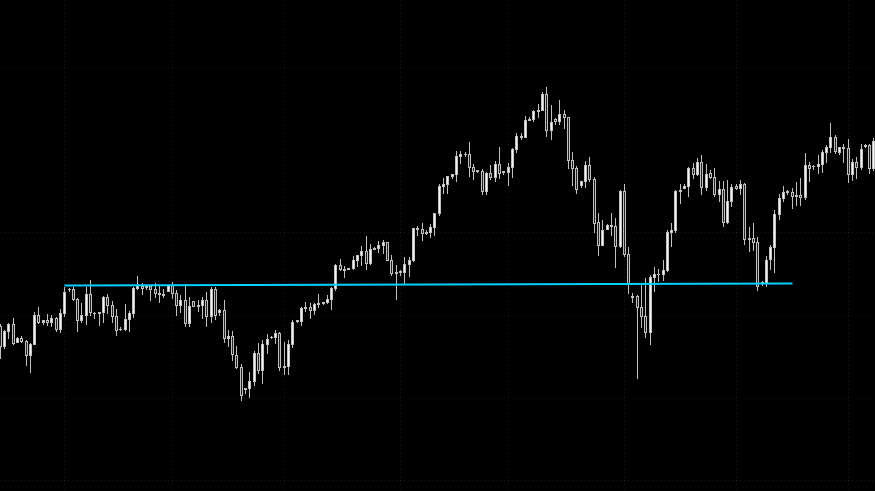
Price Hits Support Level
Entry: When the price reaches a predefined support level, could indicate a potential bounce or reversal.
Explanation: Support levels are price levels where the price has historically found buying pressure. Entering at support is a classic mean-reversion strategy. This setup is based on historical price action where support levels have previously held.
Williams %R Below -90
Entry: When the Williams %R indicator falls below -90, indicating the asset is oversold.
Explanation: Williams %R is a momentum indicator that measures how close the current price is to the highest high over a period. Values below -90 suggest extreme oversold conditions. This level often signals that the selling pressure is overextended and a reversal is likely.
Volume Spike
Entry: When there is a significant spike in volume, suggesting a potential reversal due to capitulation.
Explanation: A sudden surge in volume, often accompanied by a sharp price decline, can indicate that sellers are exhausted and buyers are stepping in. This represents capitulation. A volume spike indicates heightened trading activity which can lead to a price rebound.
CCI (Commodity Channel Index) Below -100
Entry: When the Commodity Channel Index (CCI) drops below -100, indicating an oversold condition.
Explanation: CCI measures the current price level relative to an average price level over a given period. A reading below -100 suggests the price is significantly below its average. This setup often precedes a move back towards the mean.
Price Moves Outside Donchian Channel
Entry: When the price moves below the lower band of the Donchian Channel, indicating a potential mean-reversion setup.
Explanation: The Donchian Channel displays the highest high and lowest low of a security over a given period. A price moving outside the lower band suggests an extreme deviation from its recent range. This signal suggests that the price has deviated significantly from its average range.

Price Moves Outside Keltner Channel
Entry: When the price moves below the lower band of the Keltner Channel, suggesting a reversion to the mean.
Explanation: The Keltner Channel is a volatility-based indicator that uses Average True Range (ATR) to set channel lines around a moving average. This condition indicates that the price is at an extreme level relative to its recent average.
ATR Indicates Low Volatility
Entry: When the ATR indicates unusually low volatility, suggesting that a significant price move may be imminent. You could enter when the ATR is below a specified threshold, such as 1.5 times the 14-day ATR.
Explanation: ATR (Average True Range) measures the average price range over a period. Low ATR suggests volatility is compressed, often preceding a breakout or mean-reversion move. This condition indicates that volatility is compressed, often leading to a breakout or mean-reversion move.


Thank you for reading, your support on this platform has been amazing so far.
I got a strategy to show you next week, subscribe so you don’t miss it.