


11 Key Trend Filters to Improve Your Algorithmic Trading
Identifying the direction and strength of a trend is crucial for both mean-reversion and trend-following strategies.

My first algo blew up in under two weeks.
The error wasn’t the entry logic, it was my complete lack of a trend filter.
(Well, it might have also been extremely overfit)
For us algorithmic traders (or those looking to start), automating our strategies means we need objective rules for identifying trends. Relying on "feel" or discretionary analysis isn't an option. That's where robust trend filters come in.
Below are my favourite 11 trend filters that can be implemented in your automated trading systems to measure and define market trends. These are tools you can backtest and integrate into your code, whether it's for ProRealTime, TradingView, MT4/5 or any other language.
1. Moving Averages
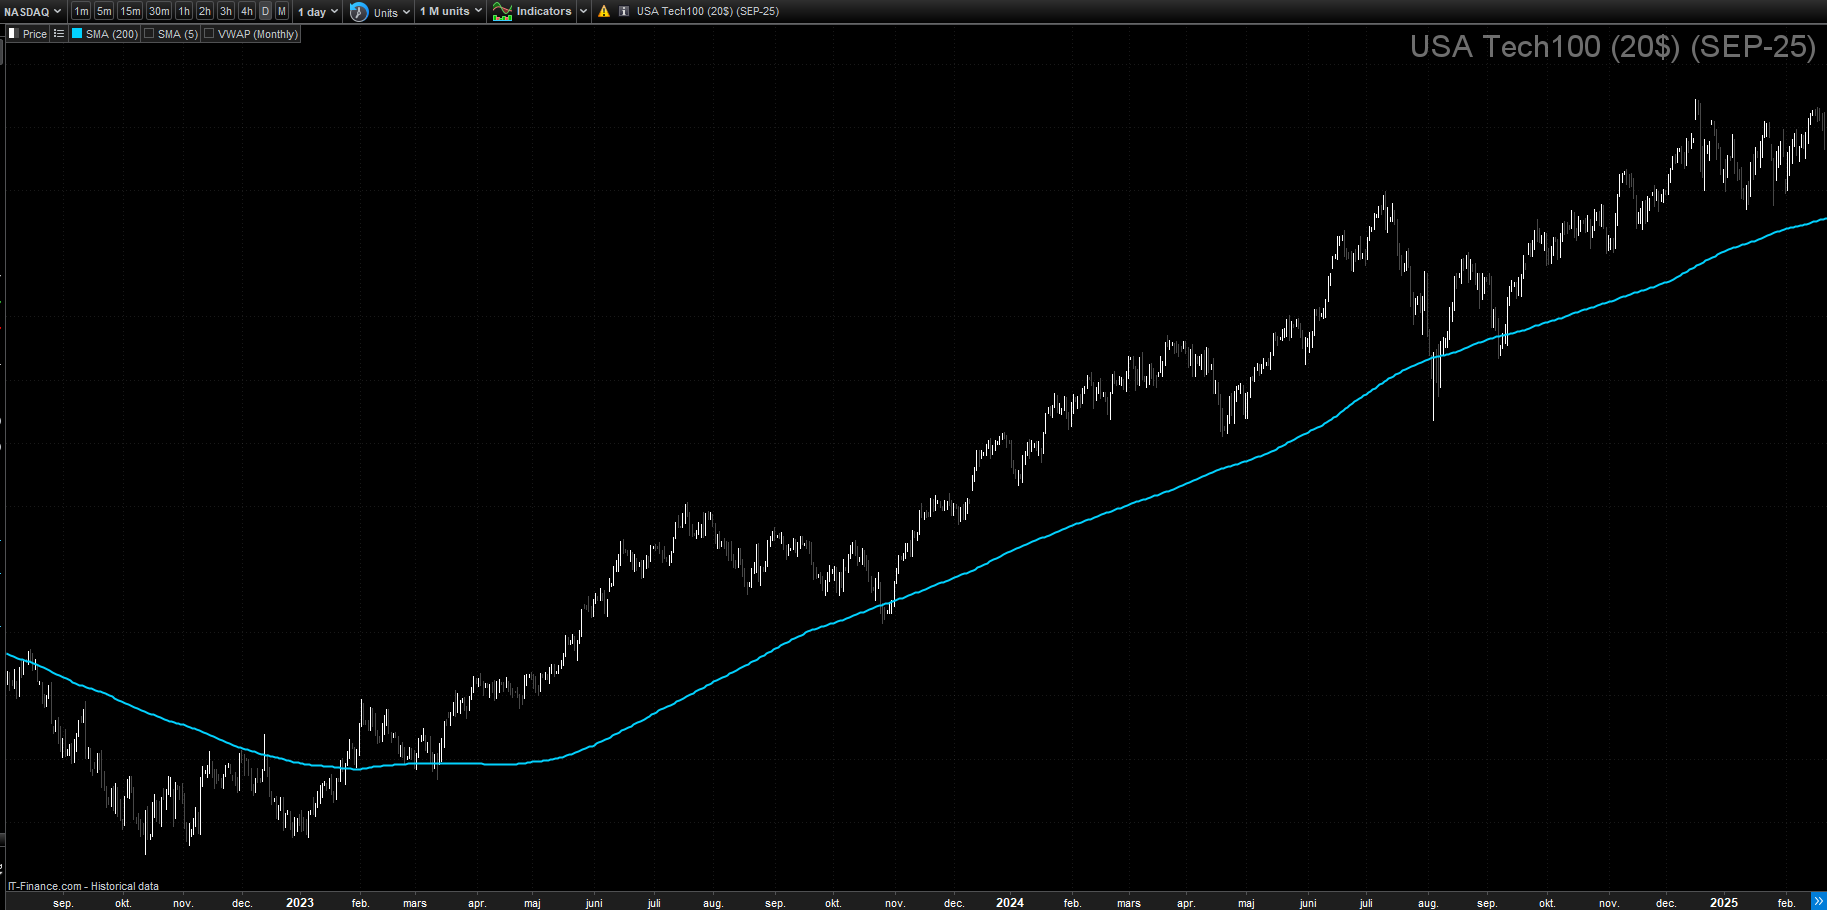
Description: Moving averages smooth out price data to identify the direction of a trend. They can be simple (SMA), exponential (EMA), weighted (WMA), or other variations. For backtesting simplicity (a key principle I have at Algomatic), using a few, well-chosen MAs is often best.
Usage:
Consider the price above a moving average as bullish, and below as bearish. This is a simple, effective filter for trend-following systems.
If a moving average slopes upwards, it indicates a bullish trend; a downward slope indicates a bearish trend. This can be coded by comparing the current MA value to a previous one.
2. Volume Weighted Average Price (VWAP)
Description: VWAP calculates the average price of an instrument, weighted by volume, over a specified period (usually intraday). It provides a more accurate reflection of an instruments true average price, particularly relevant for intraday algos.
Usage:
When the price is above the VWAP, it suggests bullish momentum; below VWAP suggests bearish sentiment.
VWAP can also act as a dynamic support or resistance level in your automated entry/exit logic.
3. Ichimoku Cloud
Description: The Ichimoku Kinko Hyo is a comprehensive indicator with multiple lines to provide support, resistance, and trend direction. The "cloud" is formed by the lagging lines Senkou Span A and Senkou Span B.
Yes, Ichimoku looks messy, but its rules are 100 % code-friendly.
Usage:
Holding trades above the cloud indicates a bullish trend; below the cloud indicates a bearish trend.
The cloud itself acts as dynamic support and resistance zones for potential automated entries or exits.
4. Linear Regression Slope
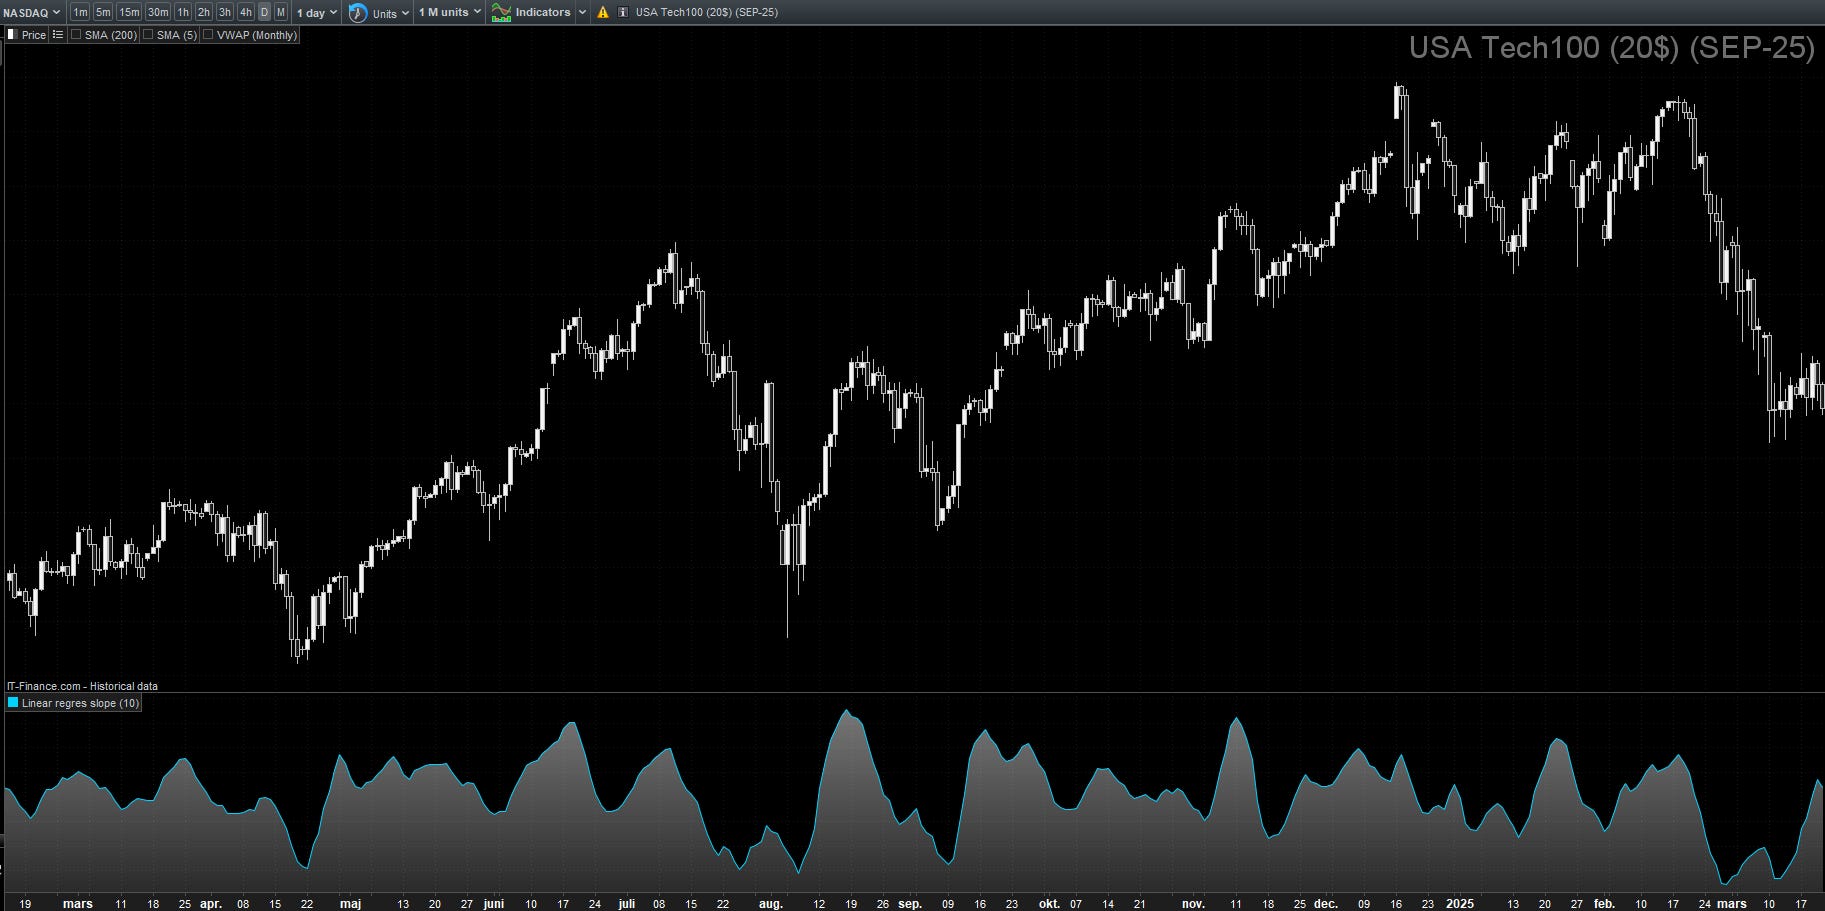
Description: Linear regression slope calculates the slope of the linear regression line fitted to price data over a specified period. It offers a more statistical approach to defining trend direction.
Usage:
A positive slope indicates an upward trend; a negative slope indicates a downward trend.
This can be used to quantify the strength and direction of a trend within your trading logic.
5. Donchian Channels
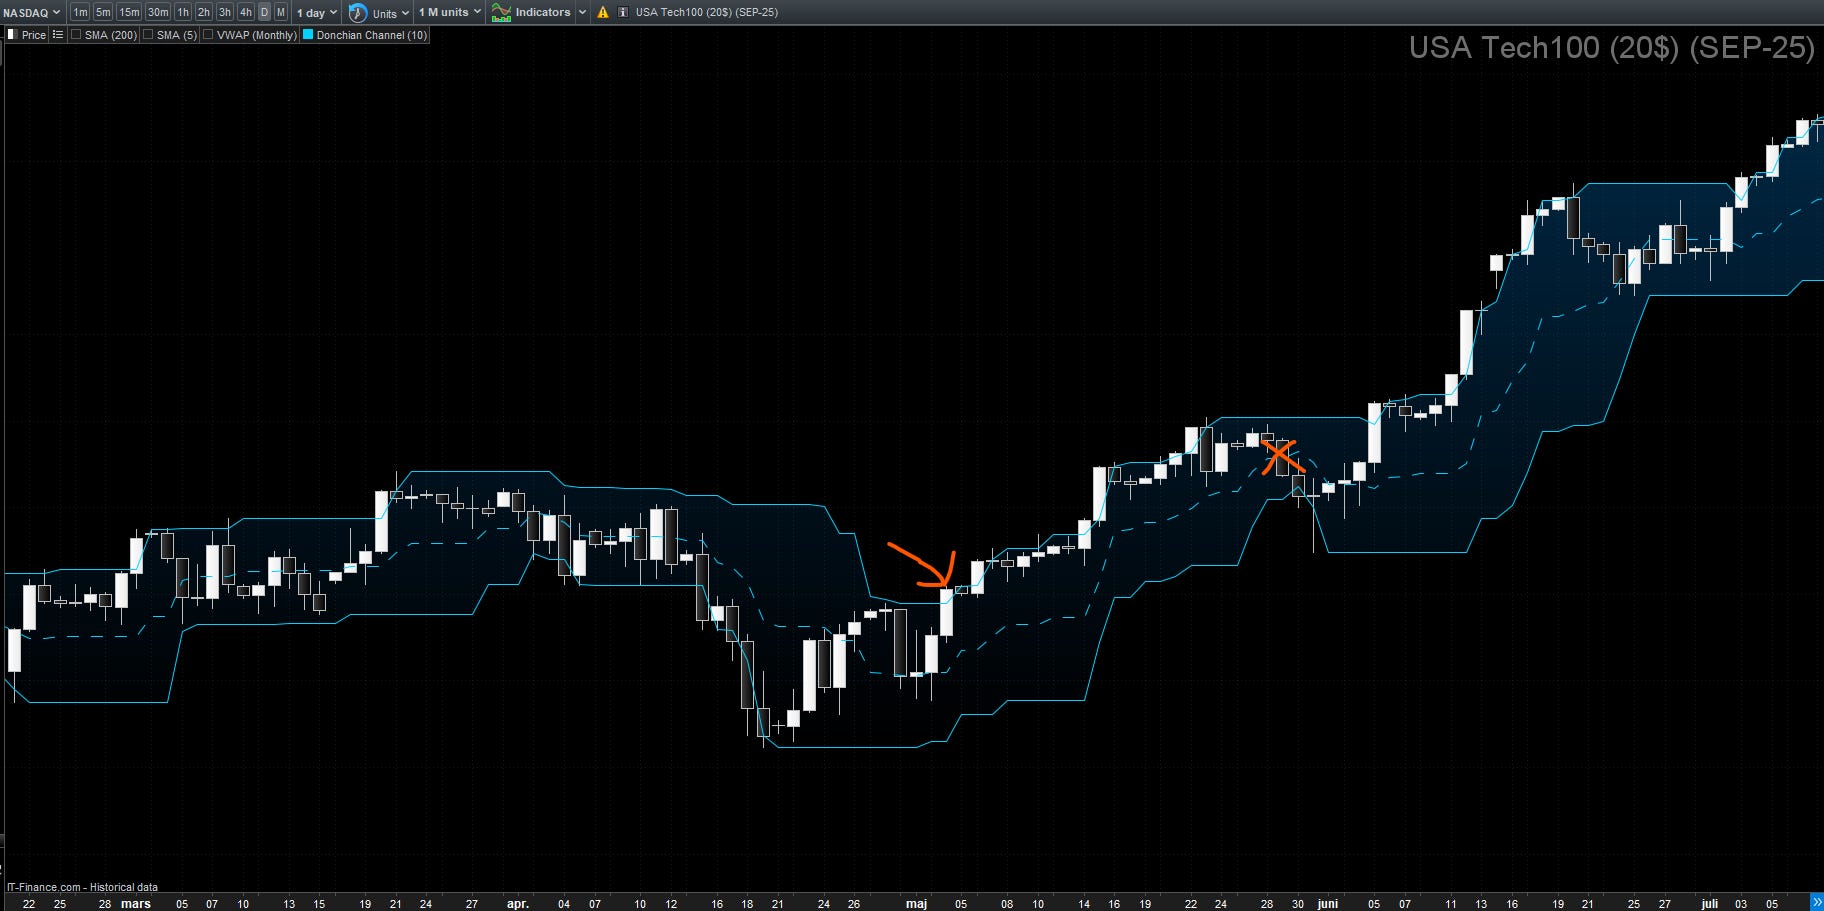
Description: Donchian Channels are formed by the highest high and the lowest low over a specified period, creating upper and lower bands. These are a staple in breakout-style trend-following systems.
Usage:
A break of the upper channel can signal a new high and the potential start of an uptrend.
The trend can be considered intact until price breaks the lower line, which might signal a downtrend or a potential exit point. The middle line can also confirm the trend direction.
6. Parabolic SAR (Stop and Reverse)
Description: Parabolic SAR plots points above or below the price to indicate potential reversals. It's often used for trailing stops in trend-following algos.
Usage:
Points below the price suggest an uptrend, while points above the price suggest a downtrend.
It is commonly used to set trailing stop-loss levels that automatically adjust as the trend progresses.


7. Directional Index (DI) and Average Directional Index (ADX)
Description: The DI indicators measure the direction of price movement, while the ADX measures the strength of the trend. Together, they provide a powerful combination for assessing both direction and conviction.
Usage:
A positive DI (+DI) above the negative DI (-DI) indicates a bullish trend, and vice versa. This is useful for confirming direction.
An ADX above 25 suggests a strong trend, while an ADX below 20 suggests a weak or non-existent trend. Integrating ADX can help your algos avoid choppy, non-trending markets.
8. Relative Strength Index (RSI)
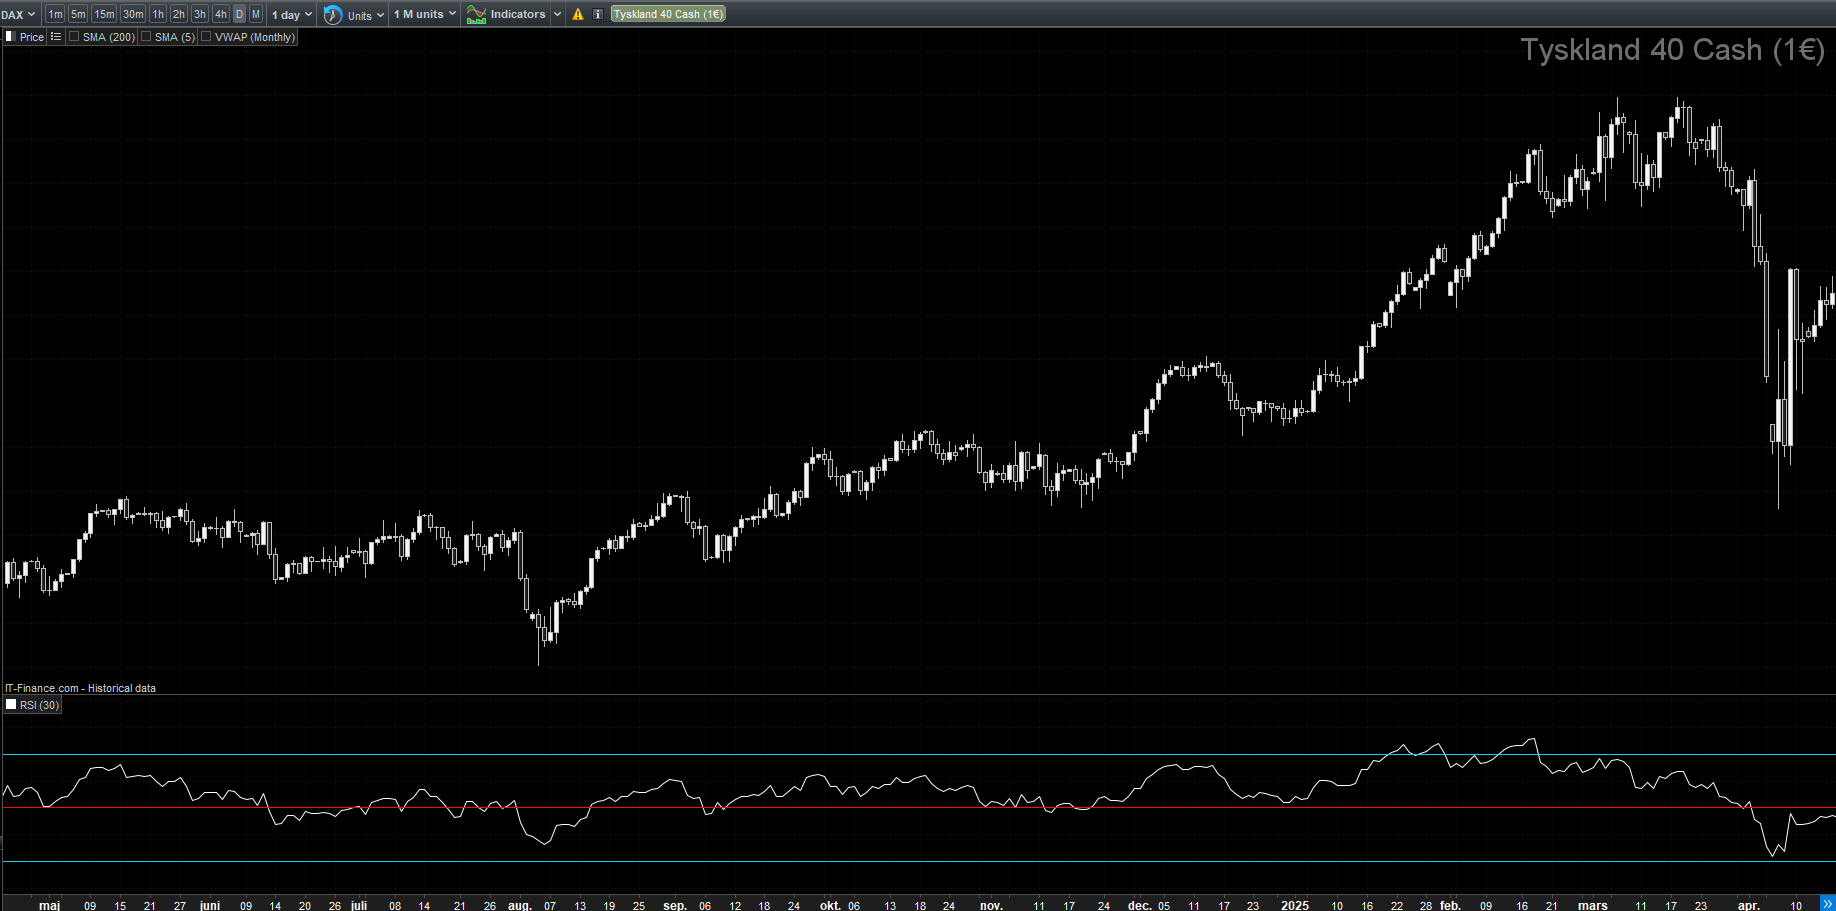
Description: RSI is a momentum oscillator that measures the speed and change of price movements. While often used for overbought/oversold conditions, it can also be adapted as a trend filter.
Usage:
For trend identification, use a longer lookback period than the standard 14 periods to reduce noise.
An RSI above 50 can suggest a bullish trend bias, while an RSI below 50 can suggest a bearish trend bias. This can help confirm direction alongside other indicators.
9. SuperTrend
Description: The SuperTrend indicator is a trend-following indicator that uses ATR (Average True Range) to define the trend. Its clear, stair-step appearance makes it easy to interpret and code.
Usage:
When the price is above the SuperTrend line, it indicates a bullish trend. Your algo might maintain long positions.
When the price is below the SuperTrend line, it indicates a bearish trend. Your algo might maintain short positions or exit longs.
10. On Balance Volume (OBV)
Description: OBV uses volume flow to predict changes in stock price. It accumulates volume on up days and subtracts volume on down days, providing insight into the conviction behind price movements.
Usage:
An increasing OBV confirms an uptrend, suggesting volume is supporting higher prices.
A decreasing OBV confirms a downtrend, suggesting volume is supporting lower prices. To enhance trend identification, you can use a moving average of the OBV.
11. Trend Lines and Channels
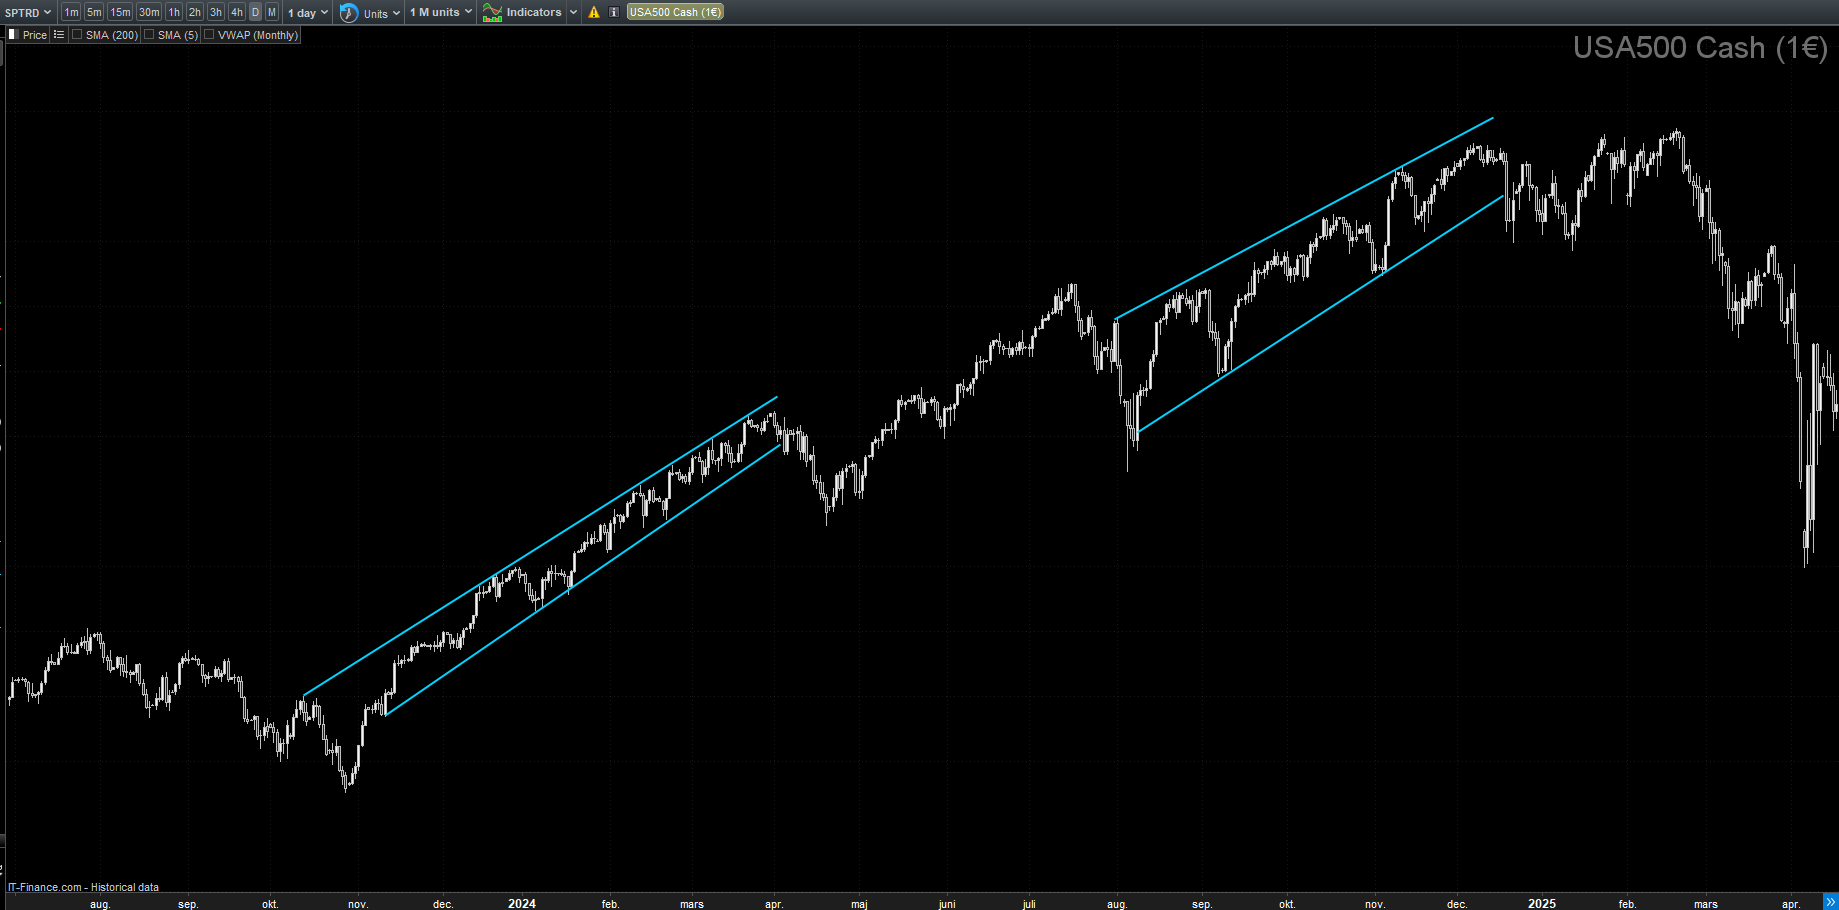
Description: Trend lines are drawn along higher lows in an uptrend or lower highs in a downtrend. Channels consist of two parallel trend lines that encapsulate price action. While traditionally drawn manually, their principles can be coded using linear regression or other methods to define boundaries.
Usage:
Breaks of trend lines can signal potential trend reversals and automated exit points.
Channels can help identify support and resistance levels within a trend for automated entry or scale-in opportunities.
Implementing these trend filters into your algorithmic trading can significantly improve your ability to identify and capitalize on market movements. Remember to backtest each filter and read about it to understand its performance characteristics and avoid curve-fitting.
(All content is educational; nothing here is financial advice.)