
10 Volatility Filters Every Serious Trader Needs
How to Adapt to Changing Market Conditions Using Volatility

If you are a systematic or discretionary trader then you know that simply predicting direction isn't enough.
The volatility dictates risk, reward, and ultimately, your profitability.
Ignoring volatility is like driving blind folded.
Most traders rely on gut feelings or indicators for market conditions. But what if there was a way to quantify market behavior with precision, allowing you to adapt your strategies?
This isn't just about avoiding losses, it's about seizing opportunities nobody else sees.
We're going to reveal 10 price-based volatility filters that will transform how you interact with the market. Forget the usual suspects, these are the tools sophisticated traders use to manage risk, find breakouts, and improve their trading ideas.
Why Your Current Approach to Volatility is Costing You
Many fall into the trap of using static strategies, regardless of market conditions. They might have a great trend-following system, but then get whipsawed in a low-volatility chop. Or they attempt a mean-reversion trade in a runaway bull market. This emotional gambling, driven by the lure of grand plans and a lack of precise market understanding, leads to frustration and account drawdowns.
The truth is, market regimes shift.
What worked yesterday might fail spectacularly today. The common mistake?
Not having objective, quantifiable methods to measure the "energy" of the market. This article arms you with the tools to fix that.
The Solution
Here's an overview of how these filters can help you:
Quantify Market Energy
Adapt Your Strategy
Optimize Risk Management
Uncover Hidden Opportunities
Methodology: How We Selected and Structured These Filters
We've curated these 10 volatility filters based on their proven effectiveness across various market conditions and trading styles. Our aim is to provide a comprehensive toolkit that can be applied to systematic, algorithmic, and manual trading alike. Each filter is presented with a clear description and its practical usage, allowing you to quickly understand its utility and integrate it into your analysis.
Detailed Walk-Through: Your Volatility Filter Handbook
Let's dive into each filter, understanding its mechanics and how you can use it in your trading:
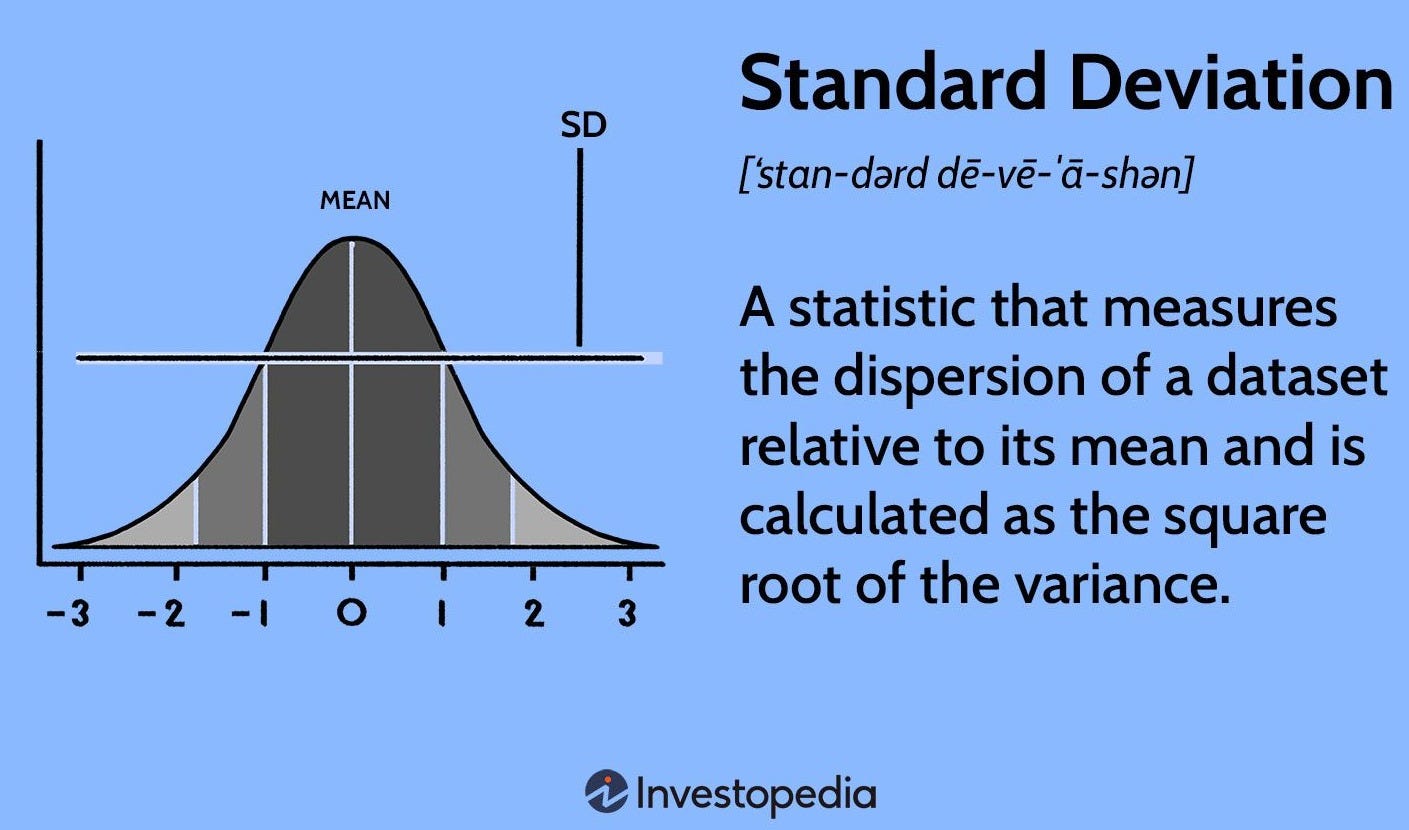
1. Standard Deviation
Description: This foundational statistical measure quantifies the dispersion of price data around its mean. It calculates the average distance of each data point from the mean price over a specified period. Standard Deviation is a cornerstone for many other indicators, including Bollinger Bands and Historical Volatility.

Usage:
High Standard Deviation: Signals higher volatility, often preceding potential breakout opportunities or indicating a riskier market.
Low Standard Deviation: Implies a stable market with less price fluctuation.
Application: Ideal for determining an asset's inherent volatility for robust risk management and setting dynamic stop-loss levels. It's suitable for all market conditions.
2. Historical Volatility (HV)
Description: HV measures the annualized standard deviation of past price changes over a specific period. It provides an empirical, straightforward measure of an asset's historical price fluctuations.
Usage:
Identify Regimes: Crucial for identifying periods of high and low volatility, allowing you to adapt your strategy accordingly.
High HV: Implies larger past price movements, making it suitable for traders seeking breakout opportunities.
Low HV: Suggests a more stable market, favoring mean-reversion strategies.
Application: Essential for analyzing past market behavior to predict potential future volatility trends.
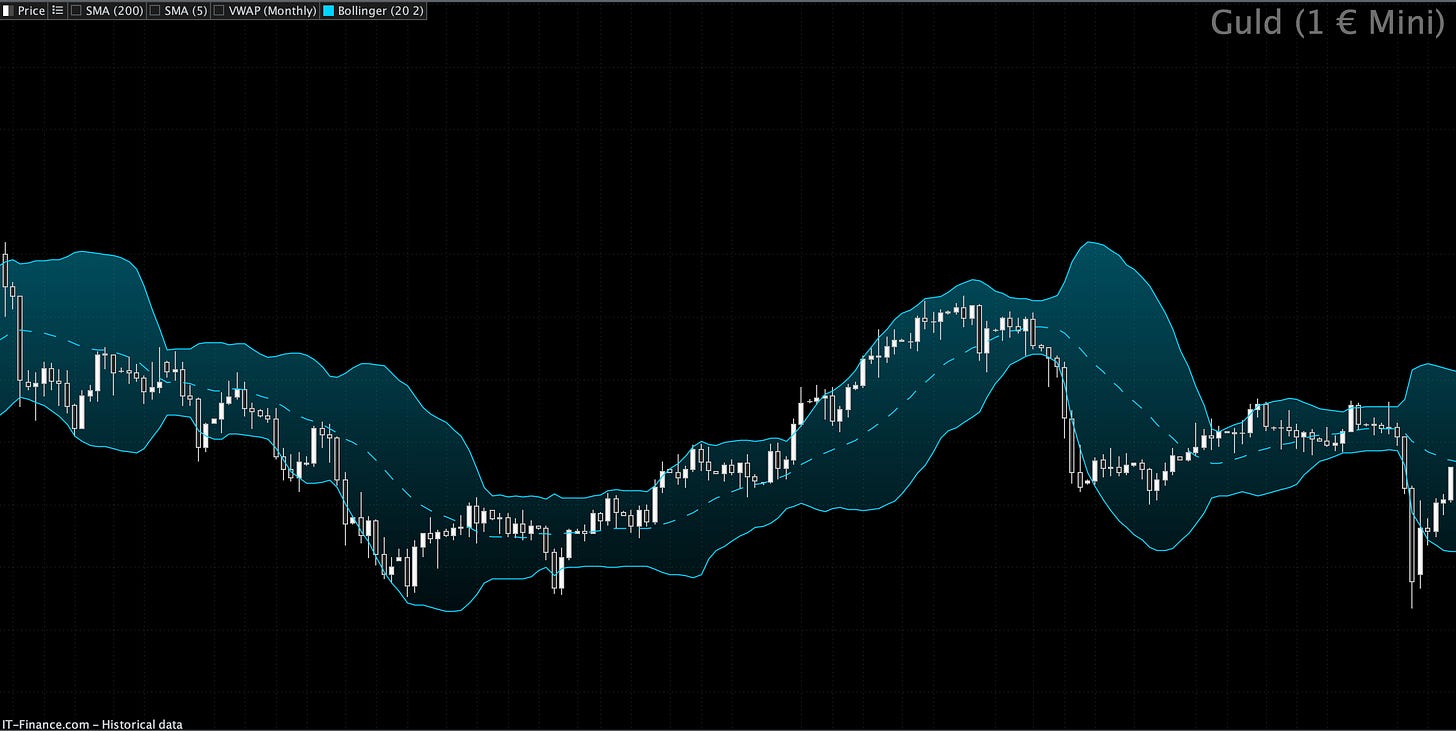
3. Bollinger Bands
Description: Developed by John Bollinger, these bands consist of a middle band (typically a 20-period Simple Moving Average) and two outer bands, usually set at two standard deviations above and below the middle band. The bands dynamically adjust their width based on market volatility.
Bollinger Bands Usage:
Gauge Volatility: Visually represent price extremes and volatility levels.
Narrow Bands: Indicate low volatility and often precede significant price breakouts (the "squeeze").
Wide Bands: Suggest high volatility, potentially offering mean-reversion opportunities as prices may revert to the mean .
Application: Excellent for volatility analysis, detecting breakouts, and mean-reversion strategies. The "Bollinger Bandwidth" indicator (the width of the bands) can also be explicitly used as a volatility filter.

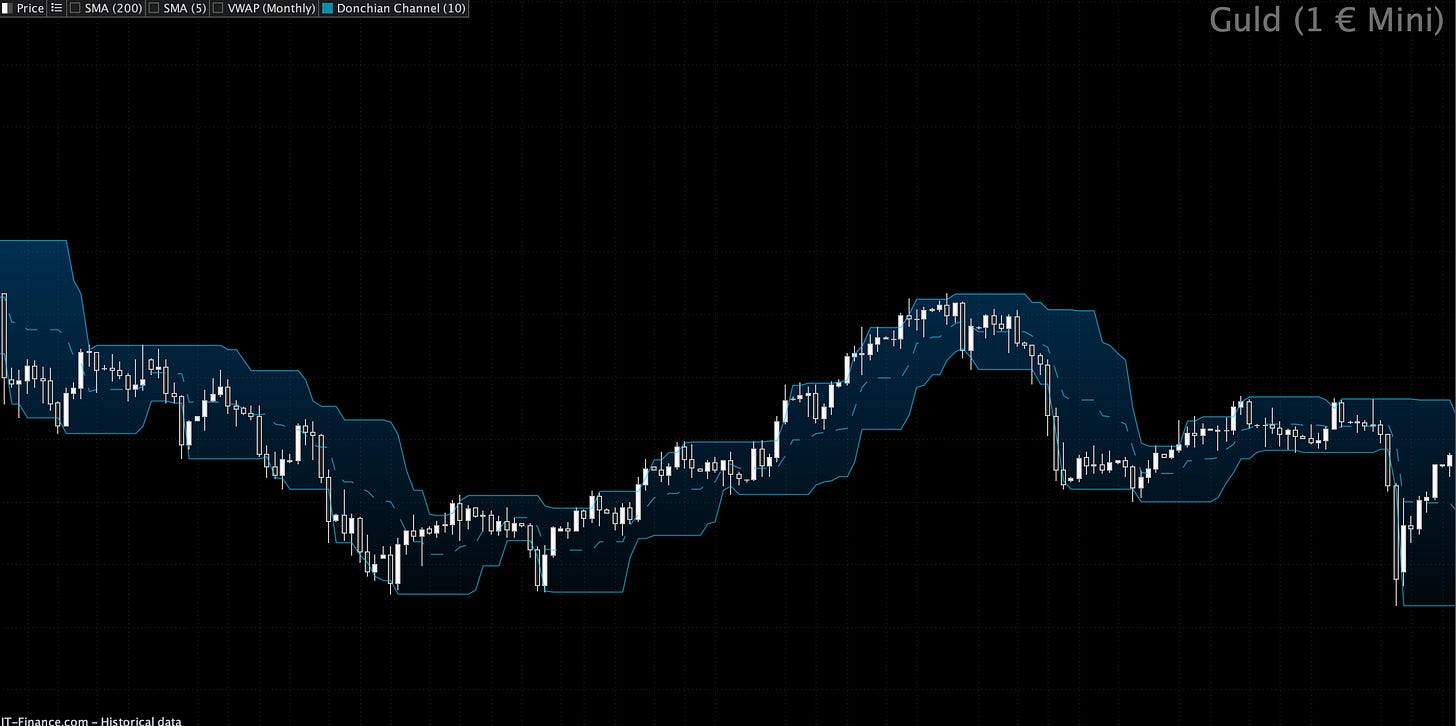
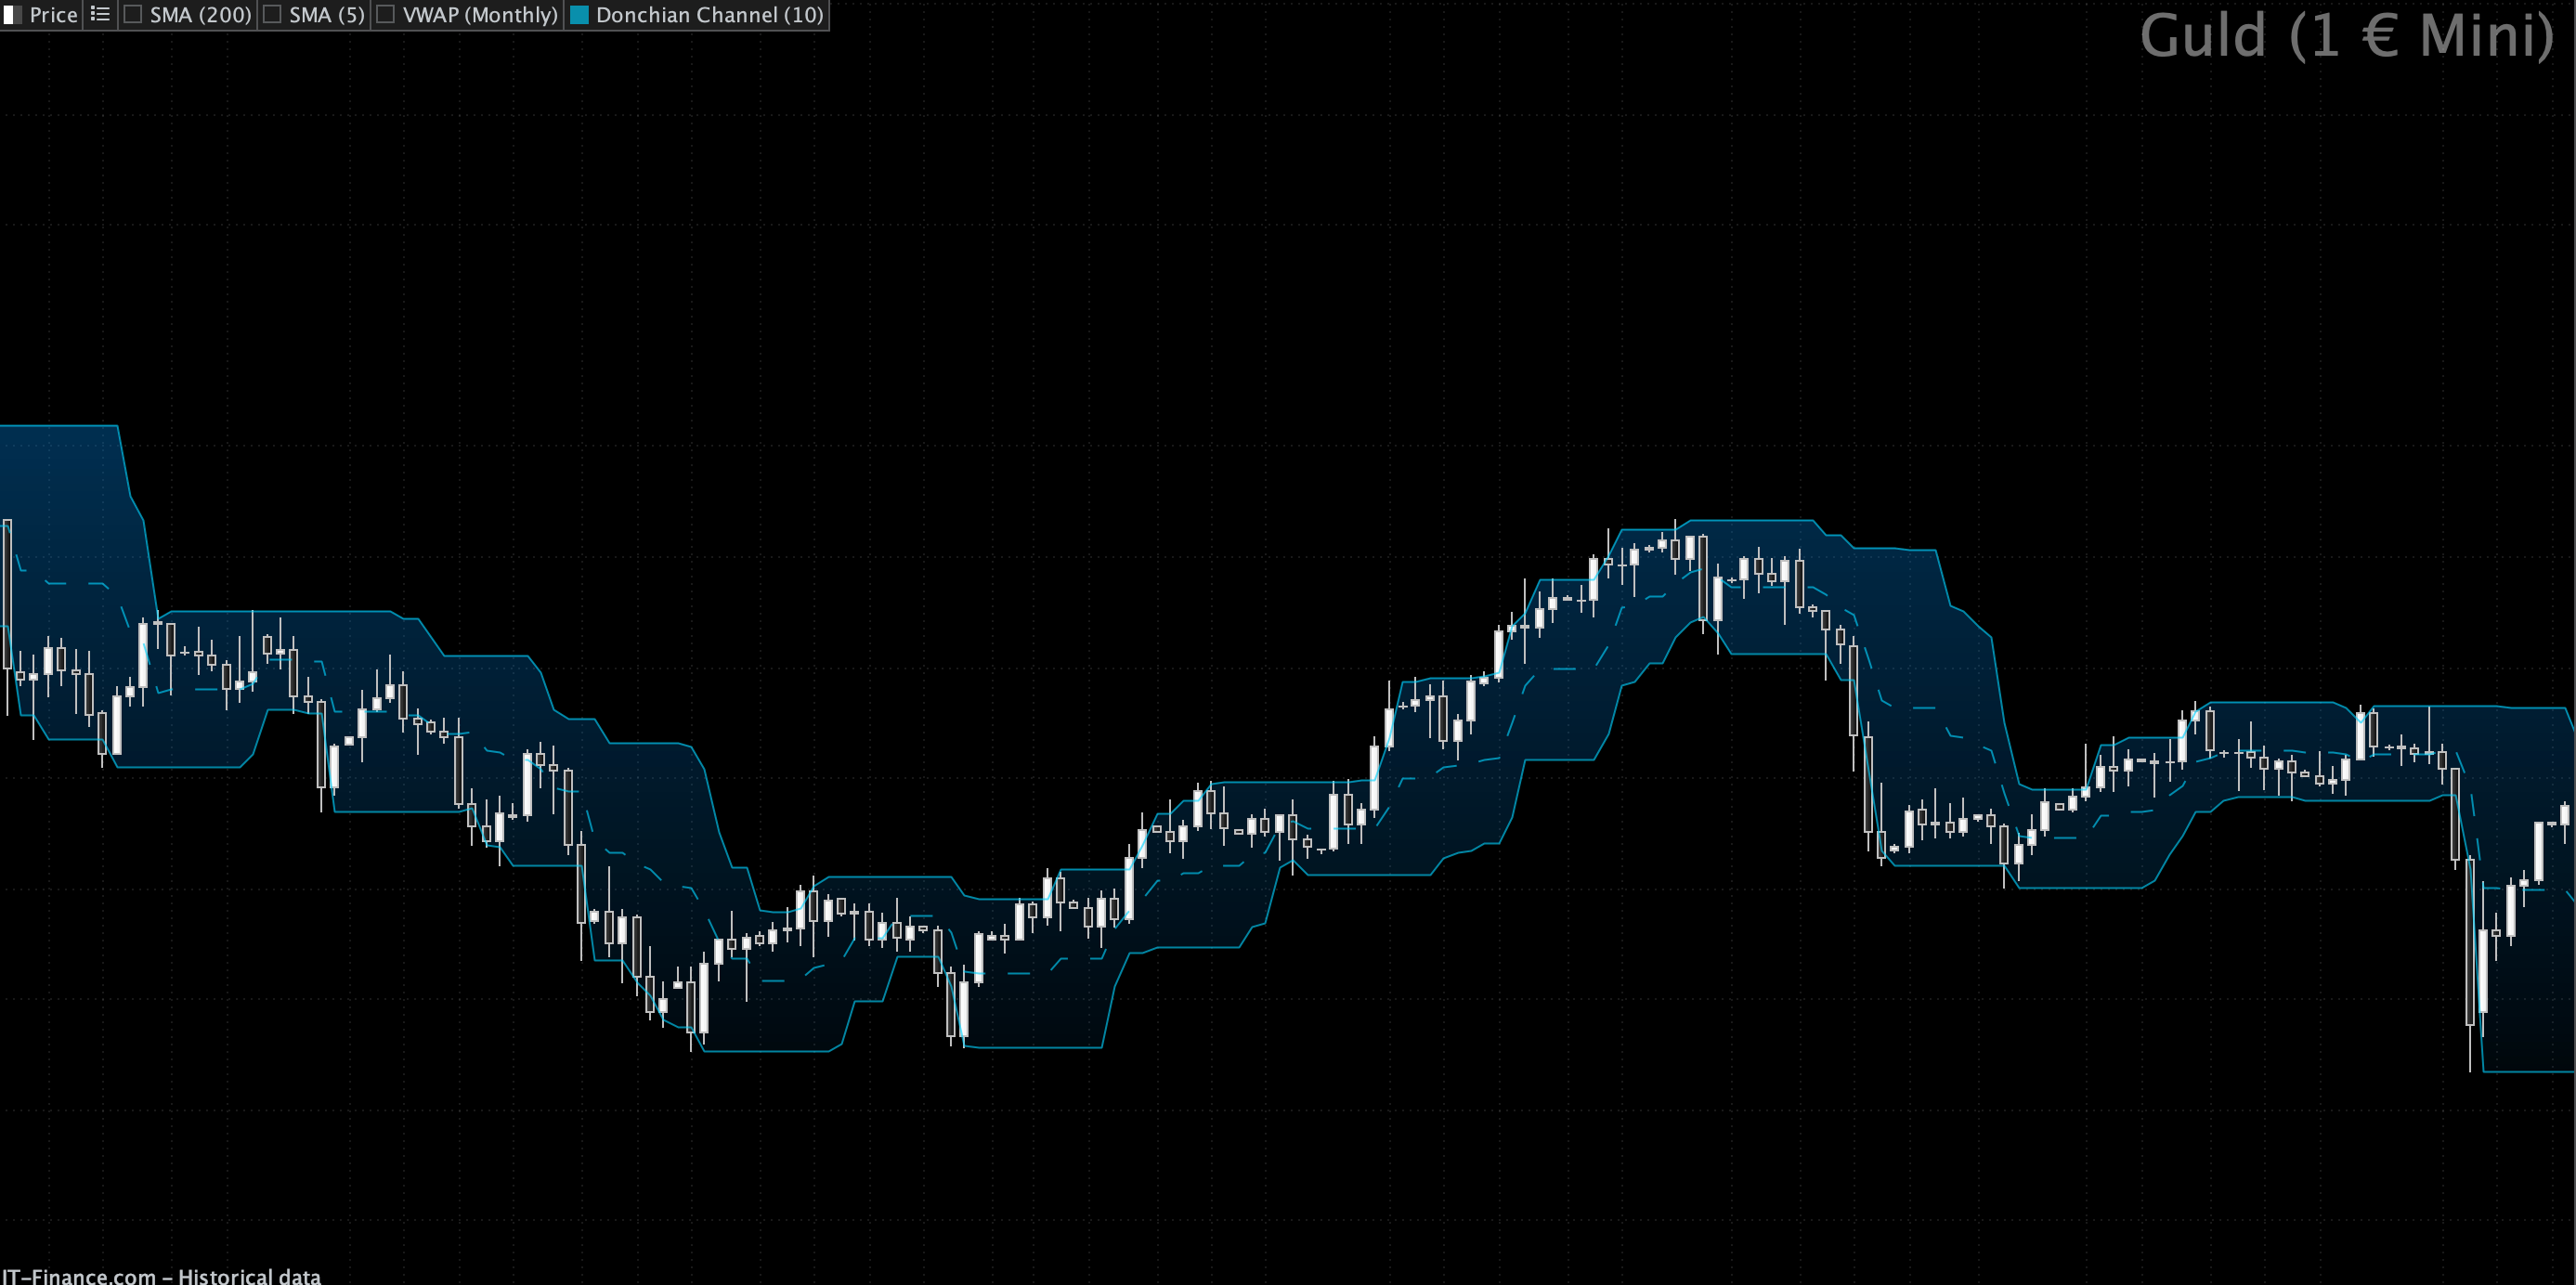
4. Donchian Channels
Description: Pioneer Richard Donchian's channels are formed by the highest high and lowest low over a specified period (e.g., 20 days). They create an envelope that highlights the price range, often used in trend-following systems.
Donchian Channel Usage:
Volatility Indicator: The width of the channel directly reflects the level of volatility; wider channels indicate higher volatility.
Breakout Identification: Primarily used for breakout strategies, where exiting the channel suggests a new trend.
Application: Particularly useful for identifying volatility trends within trending markets, signaling when a market is expanding its range.
5 . Average True Range (ATR)
Description: ATR, introduced by J. Welles Wilder Jr., measures market volatility by calculating the average range between high and low prices over a specified period, typically 14 days. Crucially, it accounts for price gaps and limit moves, offering a more comprehensive measure of volatility than simple daily range.
Usage:
Dynamic Stop-Losses: Higher ATR values indicate higher volatility, suggesting larger price movements and the need for wider stop-losses to avoid premature exits.
Position Sizing: Can be used to adjust your position size based on current market volatility, ensuring each trade carries an equivalent dollar risk.
Application: Suitable for all market conditions, especially for determining appropriate stop-loss levels and optimizing position sizing.
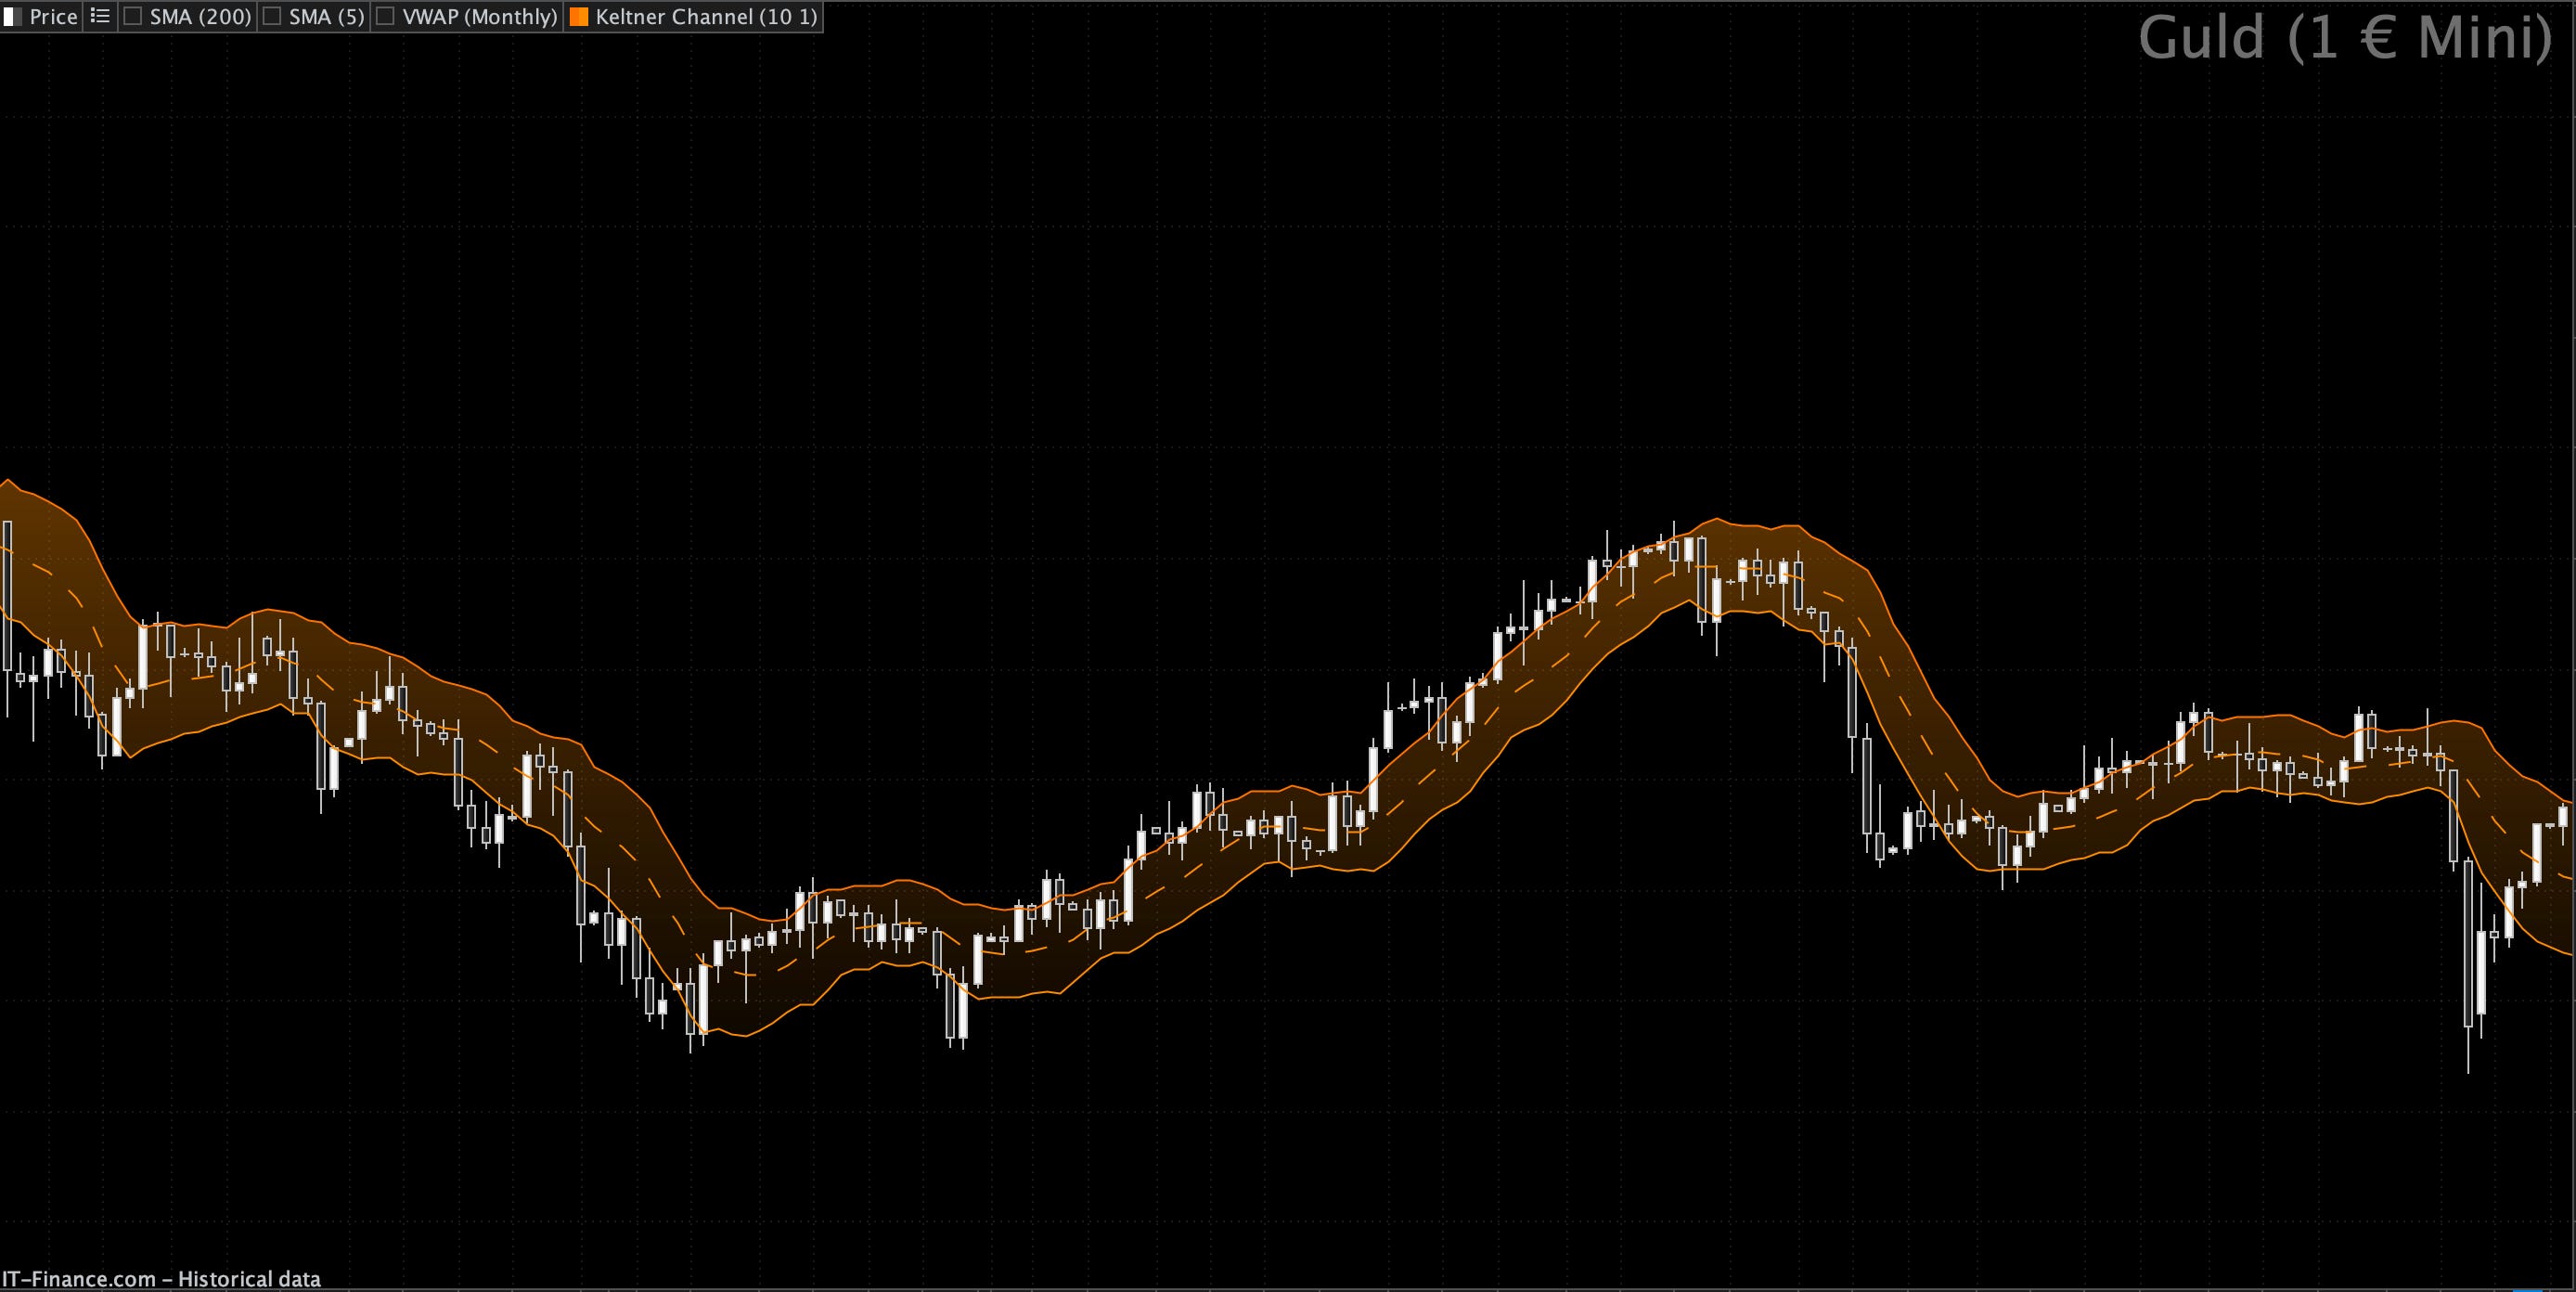
6. Keltner Channels
Description: Keltner Channels are volatility-based envelopes set above and below an Exponential Moving Average (EMA). Unlike Bollinger Bands, their channel distance is based on a multiple of the Average True Range (ATR). This makes them smoother and less prone to erratic fluctuations.
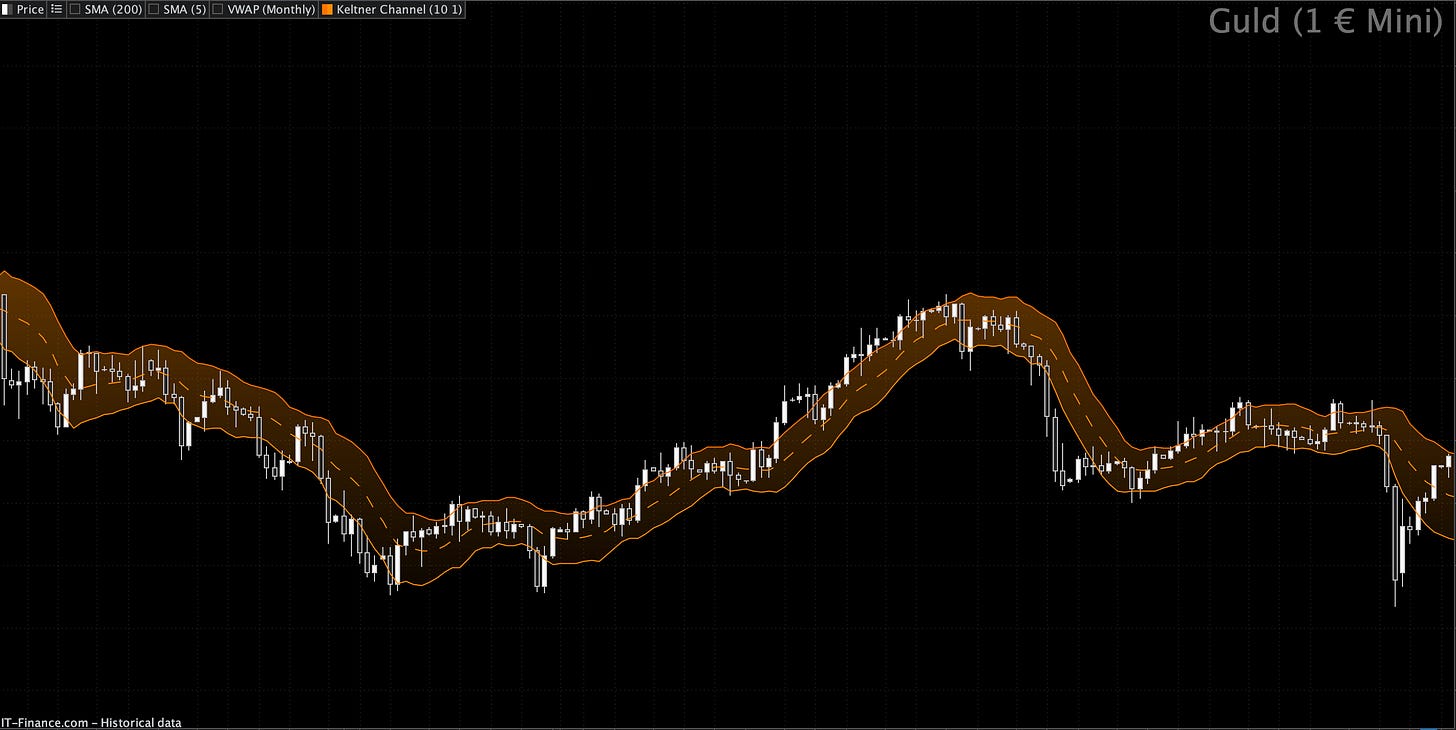
Keltner Channel Usage:
Volatility & Trend Confirmation: Wider channels indicate higher volatility, while narrower channels suggest lower volatility.
Trend Following: Price often respects the channels in trending markets, offering clear entry and exit points.
Mean Reversion: Prices pushing outside the channels can indicate overextension, potentially leading to mean reversion.
Application: Excellent for trend-following and mean-reversion strategies, as well as general volatility analysis.
7. Price Volatility Ratio (PVR)
Description: The Price Volatility Ratio compares the current price range to historical price ranges, helping to identify unusual price movements relative to established historical patterns. It provides a straightforward ratio-based measure of current volatility against historical norms.
Usage:
Identify Volatility Spikes: A high PVR suggests unusually high current volatility, signaling a potential breakout or a significant trend change.
Regime Shift Detection: Useful for detecting shifts in market volatility regimes, allowing for proactive strategy adjustments.
Application: Ideal for detecting sudden volatility spikes and fine-tuning trading strategies to align with the current market environment.
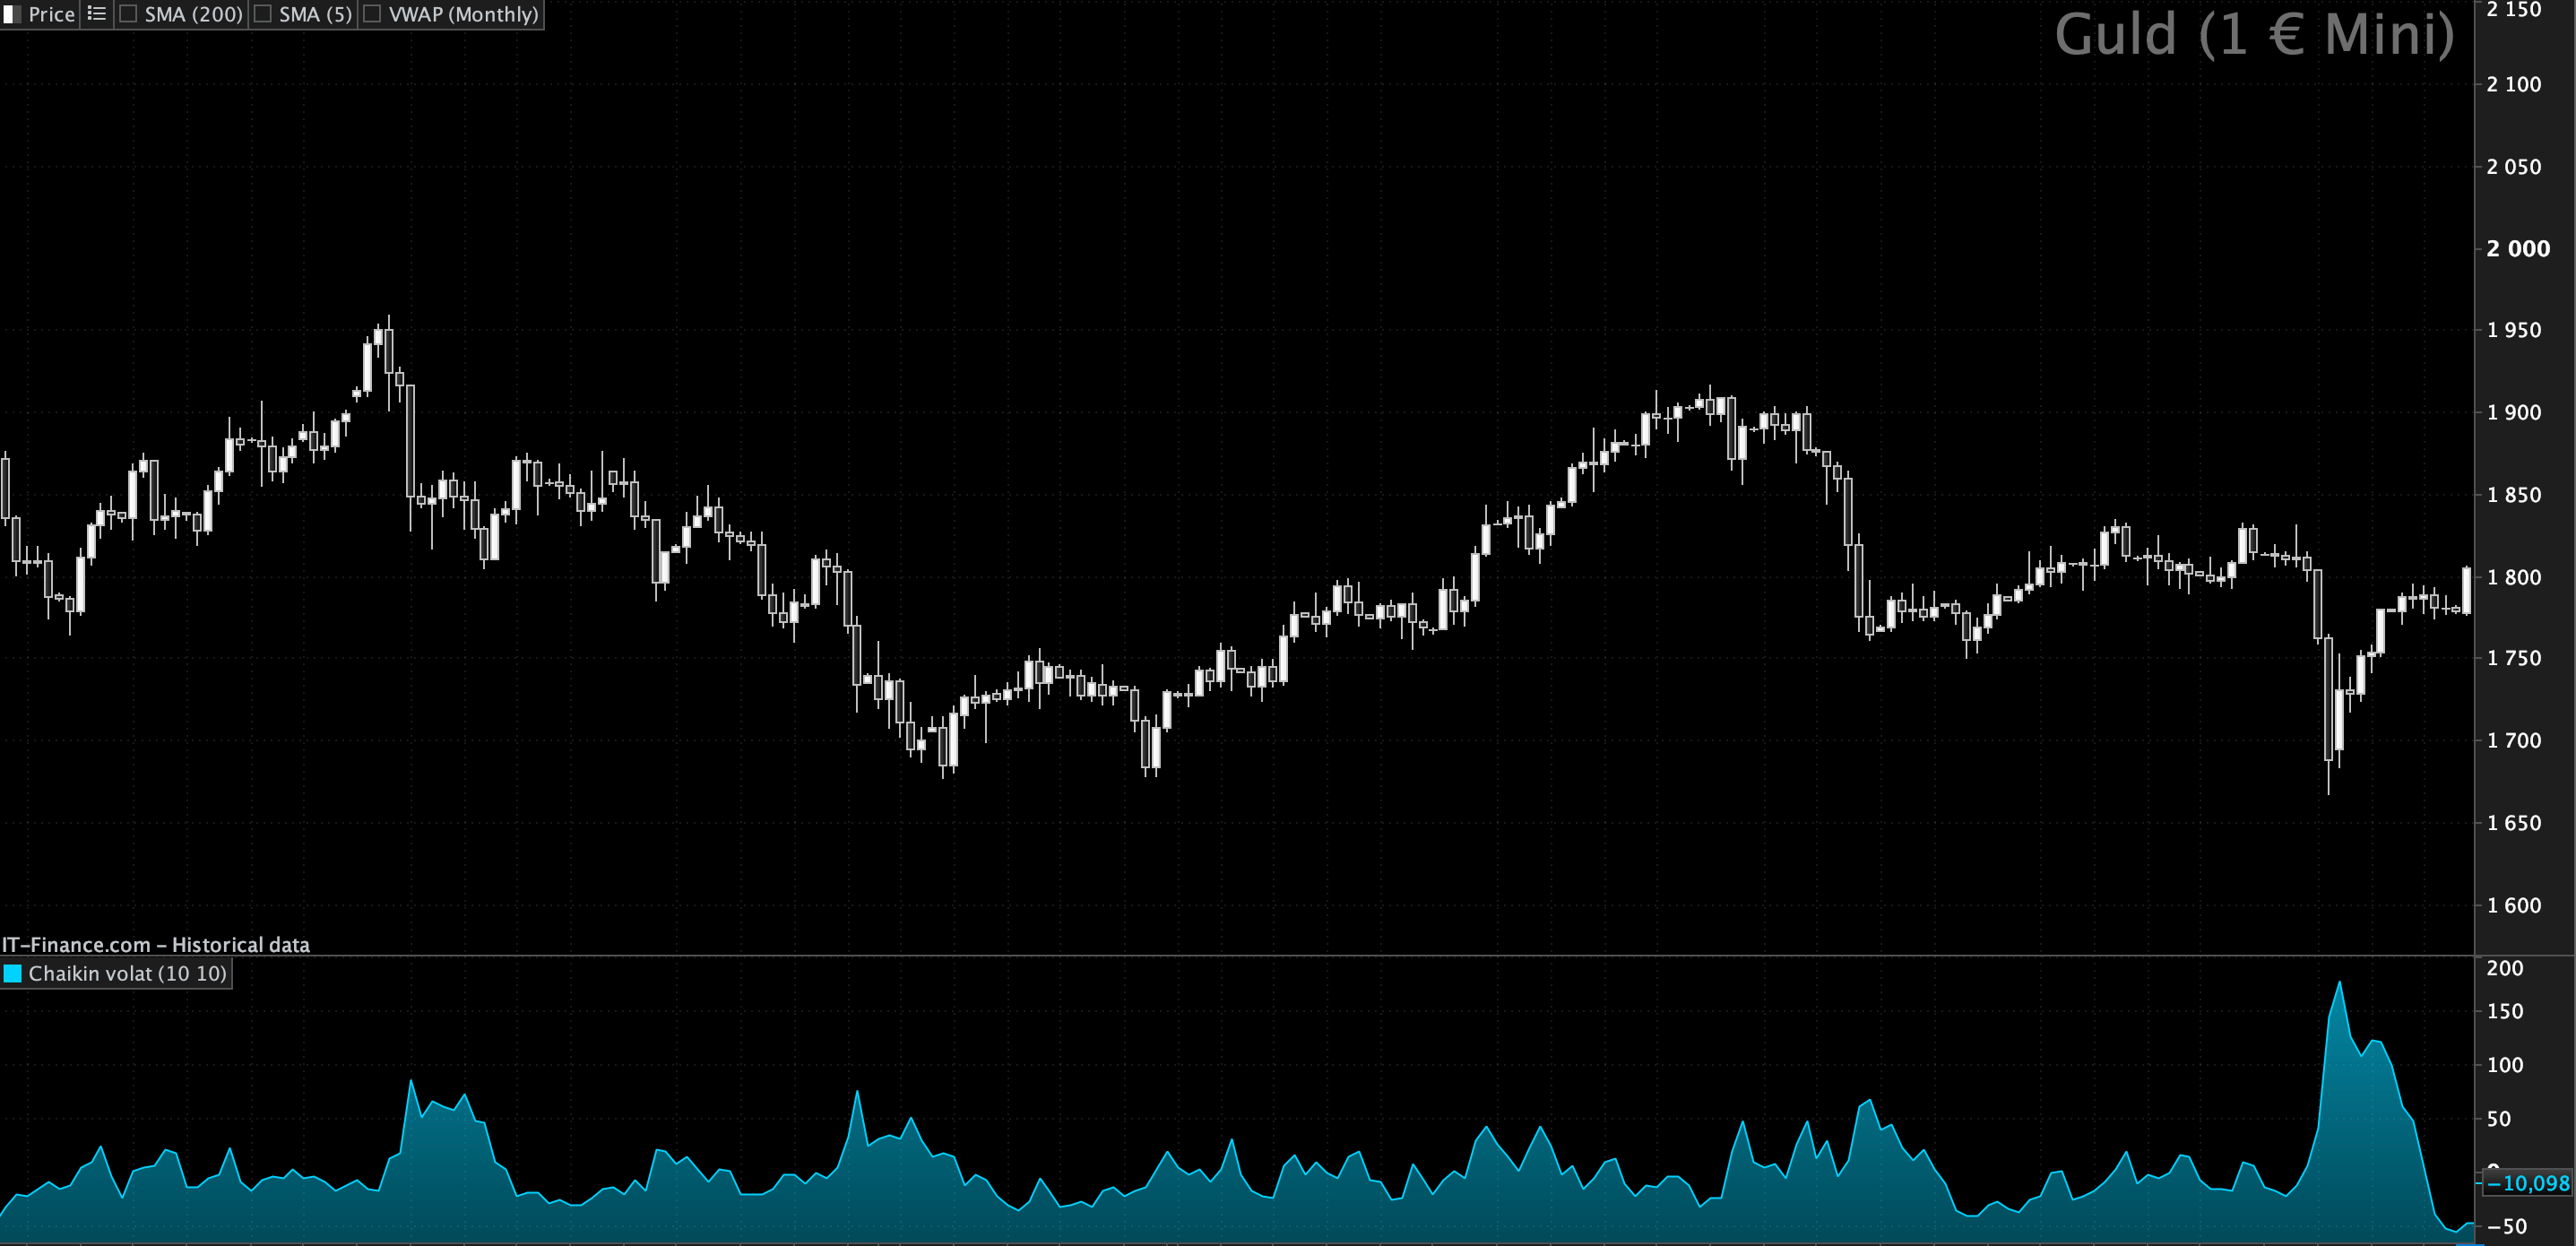
8. Chaikin Volatility (CV)
Description: Developed by Marc Chaikin, this indicator measures the difference between the high and low prices over a specified period (often using an Exponential Moving Average of this difference). It specifically emphasizes the rate of change in volatility, making it highly sensitive to rapid shifts in market behavior.
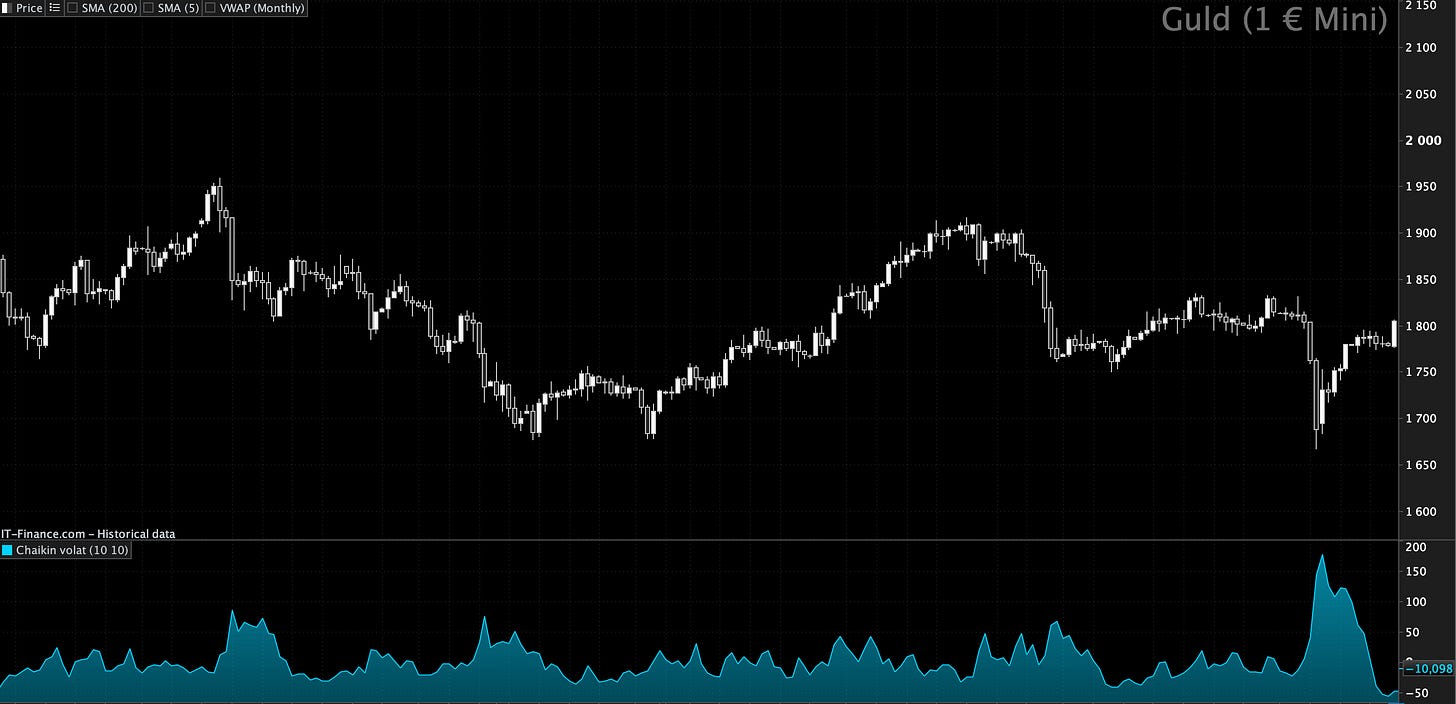
Chaikin Volatility Usage:
Identify Turning Points: Higher CV values indicate increasing volatility (often at market bottoms), while lower values suggest decreasing volatility (often at market tops).
Reversal Signals: Can help identify potential market turning points or reversals as volatility contracts or expands rapidly.
Application: Suitable for volatility analysis and identifying potential market reversals or breakouts, particularly when used in conjunction with price action.
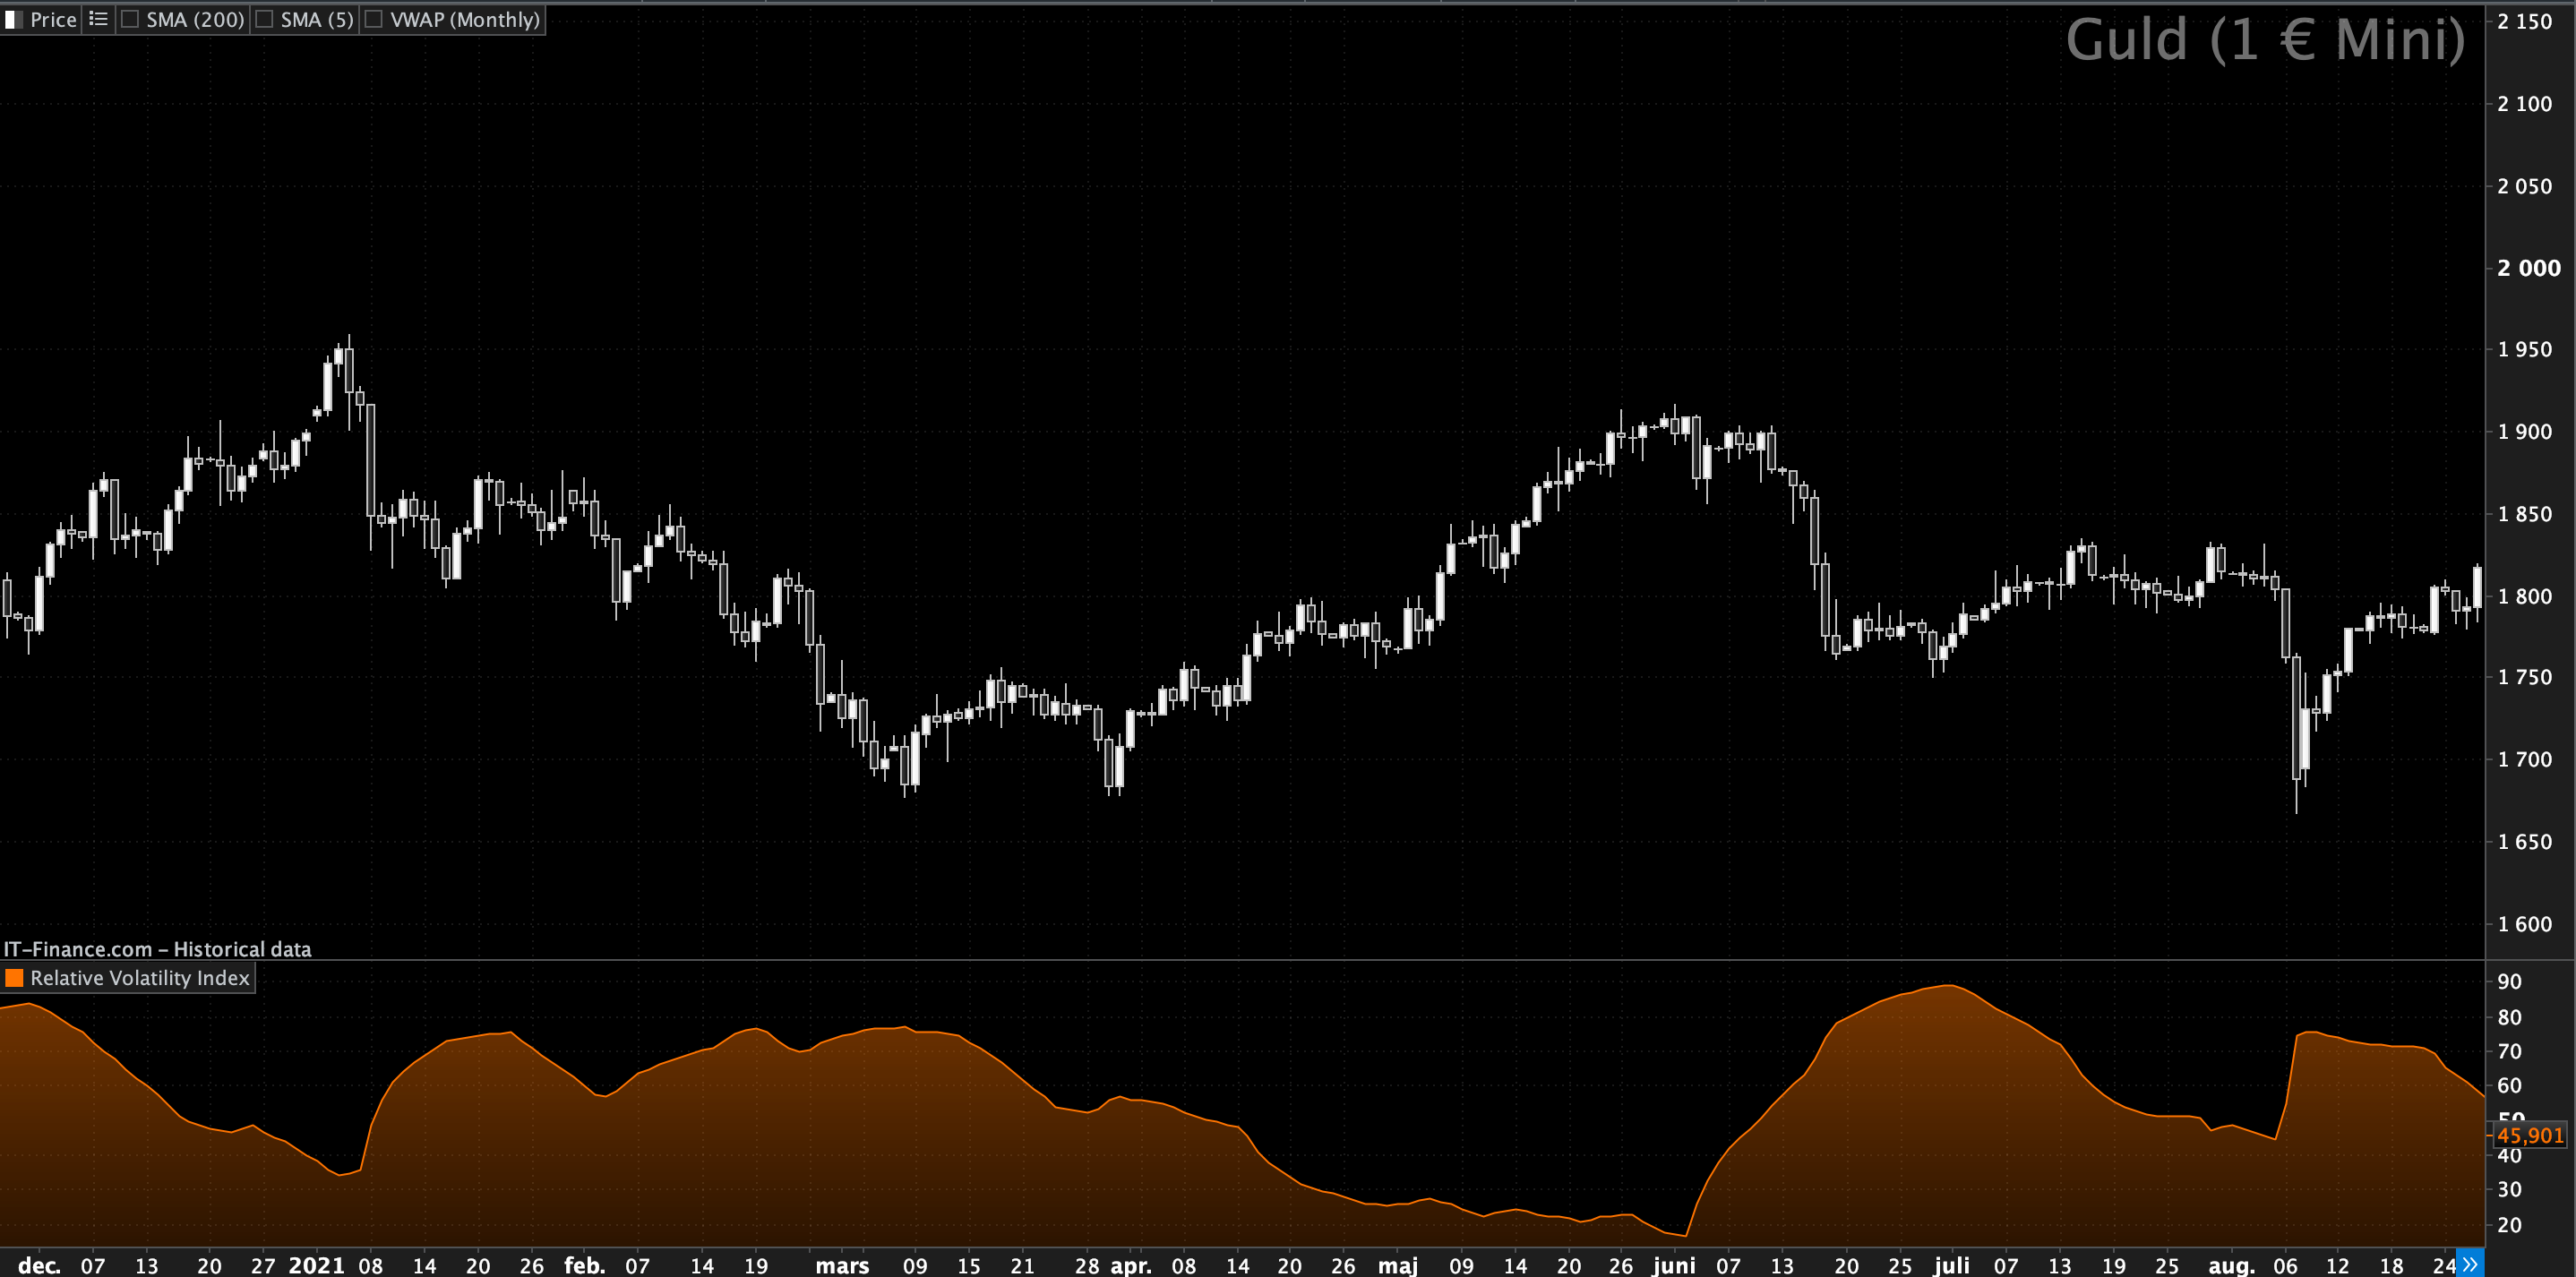
9. Relative Volatility Index (RVI)
Description: Similar in concept to the Relative Strength Index (RSI), the RVI measures the direction of volatility rather than price itself. It calculates the standard deviation of price changes over a period, providing a directional view of market volatility. The RVI combines volatility measurement with directional movement, offering a nuanced perspective.

Relative Volatility Index Usage:
Confirm Trends: RVI values above 50 generally indicate increasing volatility, confirming the strength of a price trend.
Identify Divergences: RVI values below 50 suggest decreasing volatility, potentially signaling a loss of momentum or an upcoming reversal.
Application: Useful for confirming existing trends and identifying potential reversal points in volatile markets, especially when RVI diverges from price.
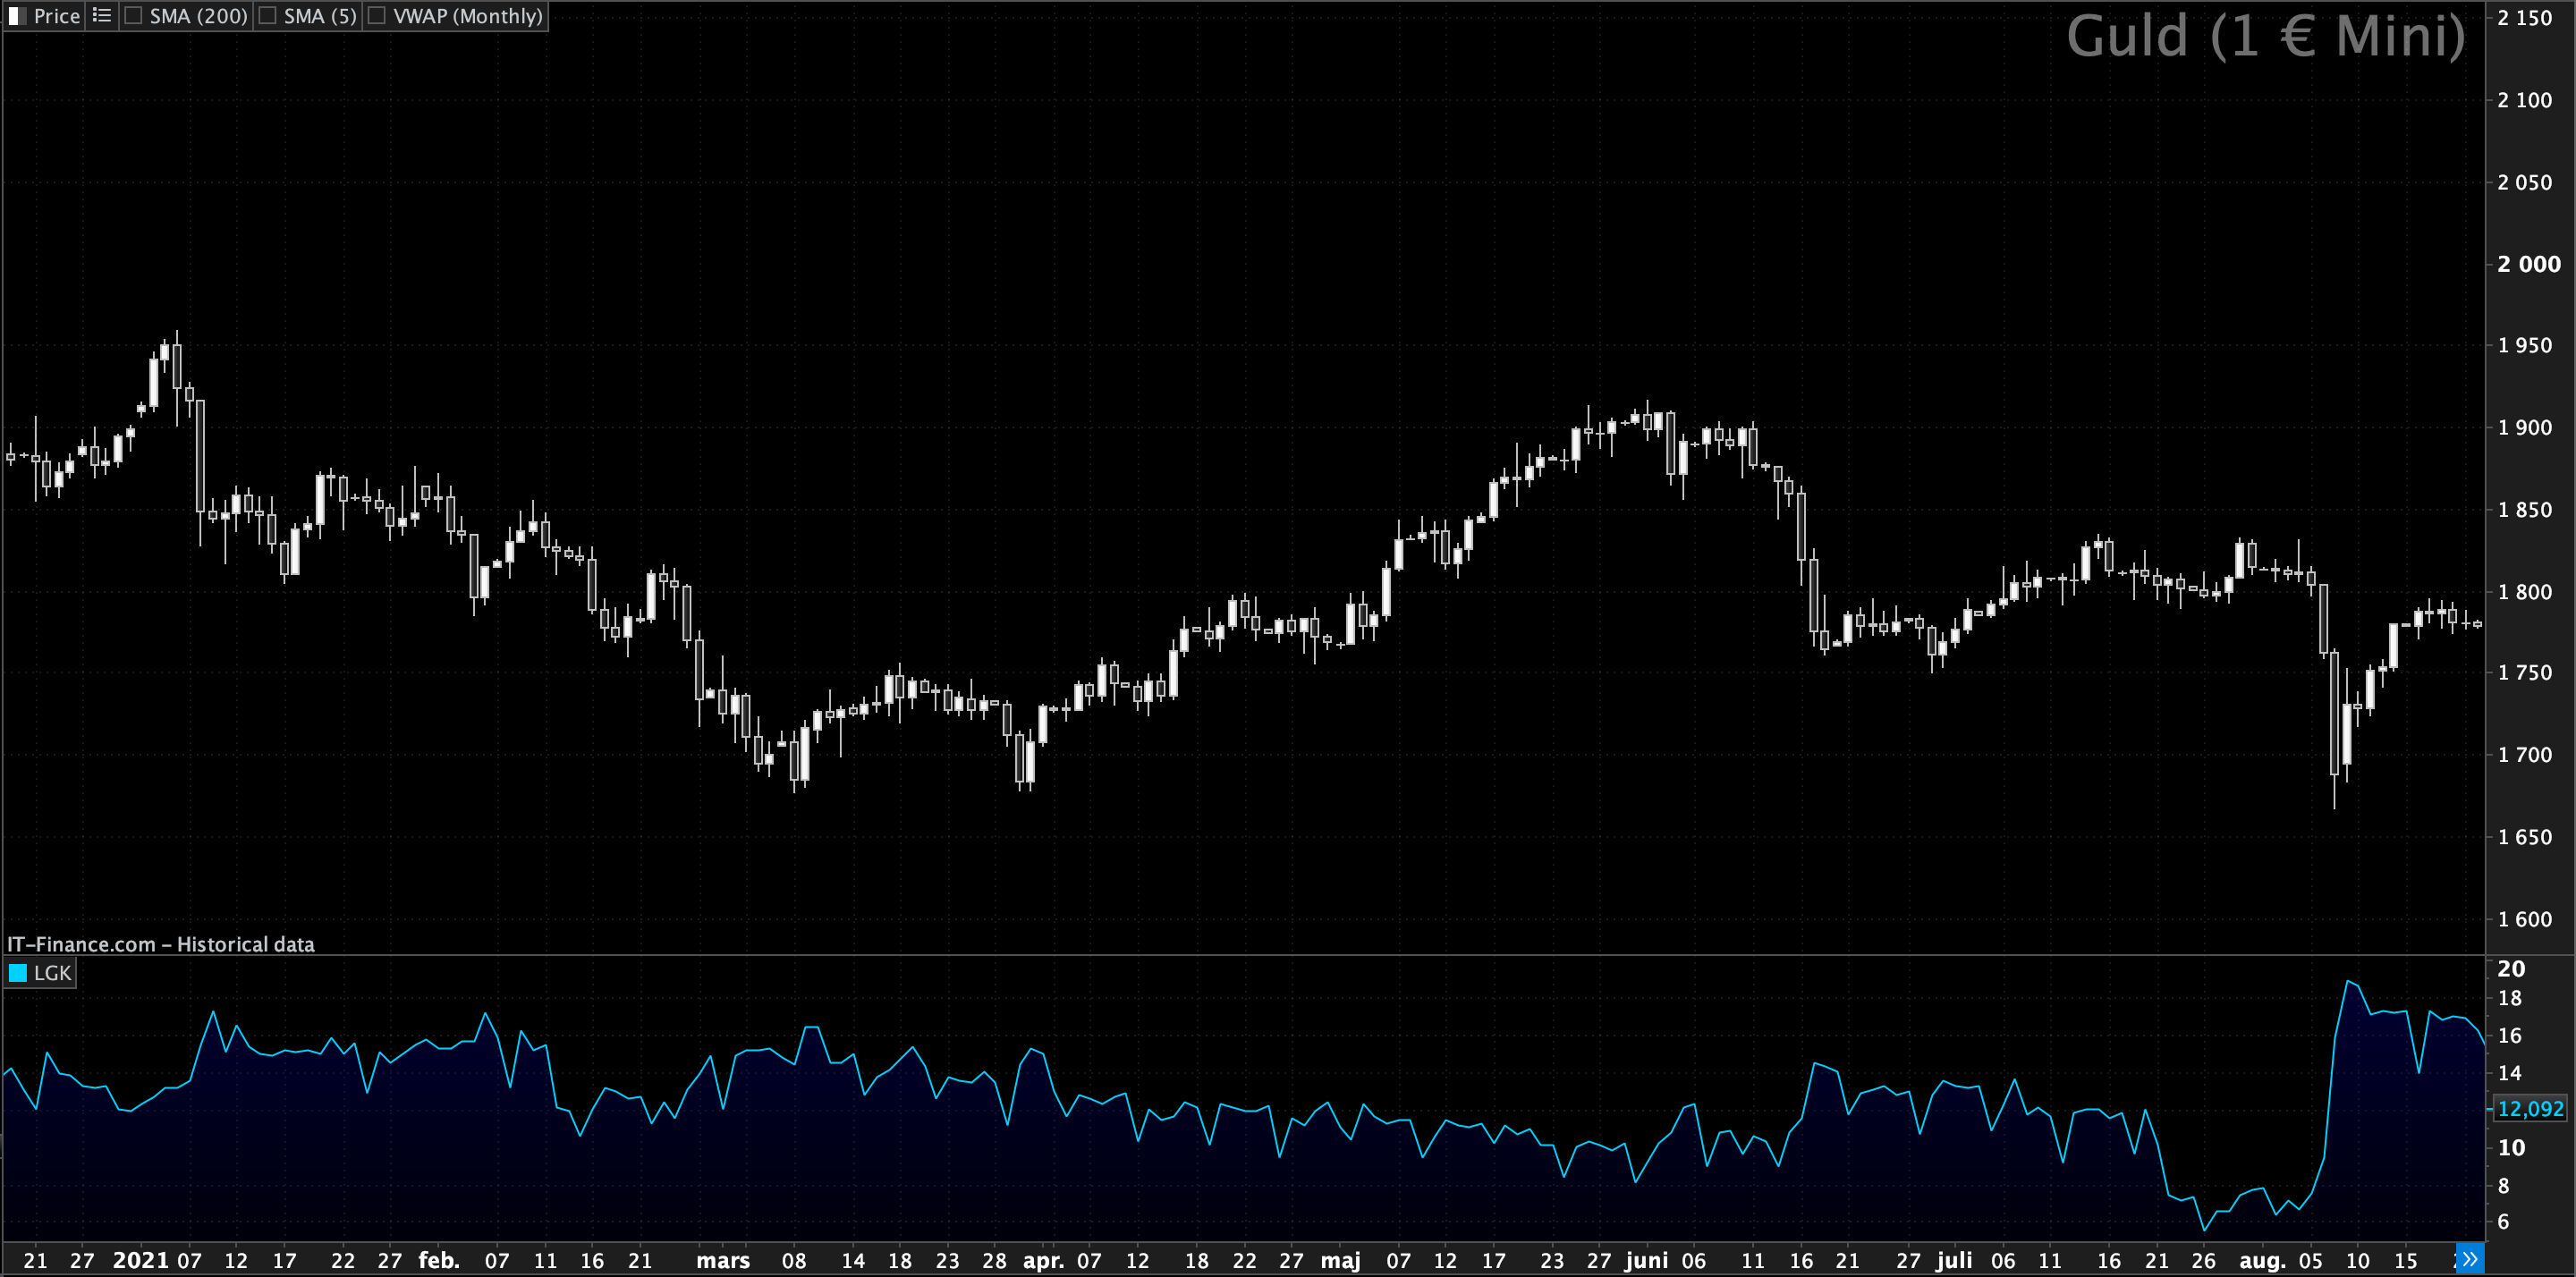
10. Garman-Klass Volatility
Description: This advanced volatility estimator utilizes opening, closing, high, and low prices within a given period to derive a more accurate measure of volatility than simpler methods. By incorporating multiple price points, it offers a more comprehensive perspective, particularly useful in markets with frequent gaps.
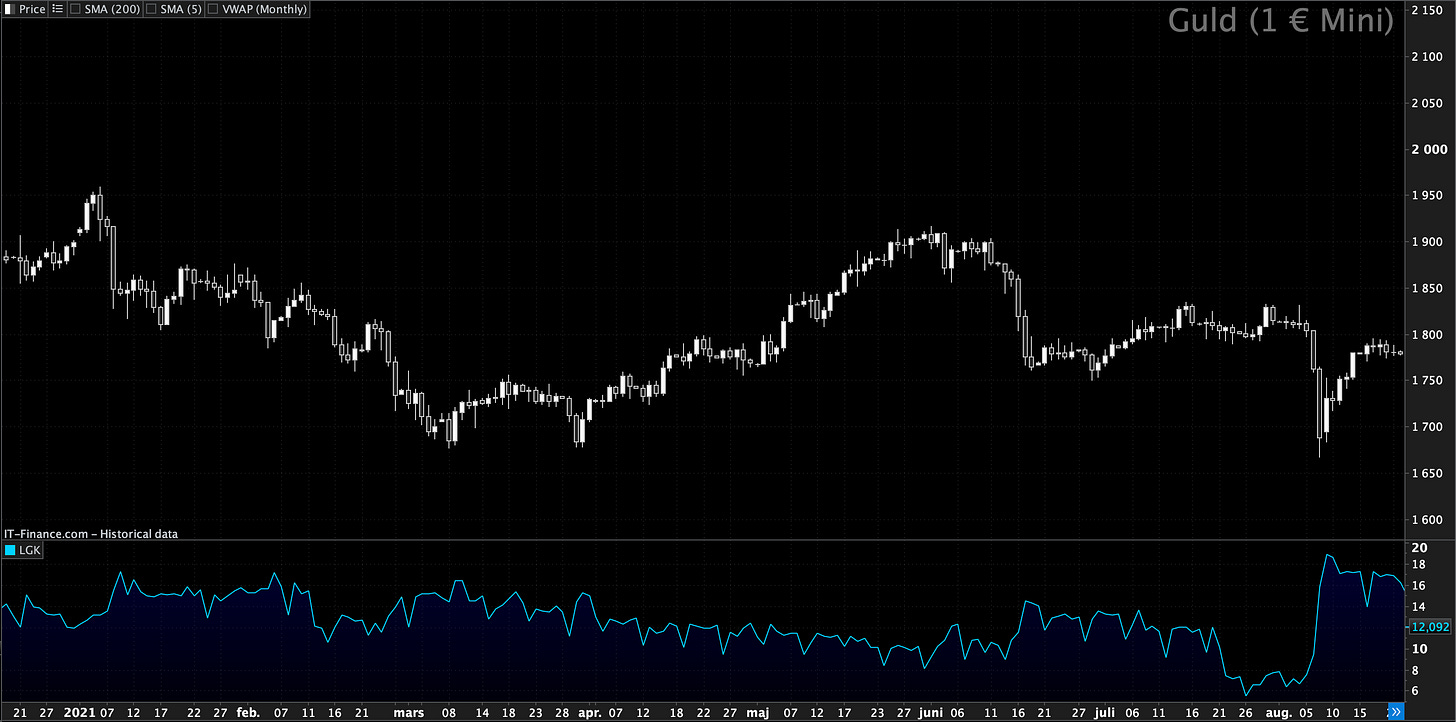
Garman-Klass Volatility Usage:
Improved Accuracy: Provides a superior estimate of "true" volatility by accounting for the full range of prices within each bar, rather than just close-to-close movements.
Intraday Analysis: Particularly beneficial for detailed volatility analysis in markets where opening and closing prices hold significant weight, or where intraday gaps are common.
Application: Best suited for those seeking a highly precise measure of volatility for sophisticated model inputs or detailed backtesting.
Why It Works: The Edge of Volatility Awareness
The power of these volatility filters lies in their ability to provide an objective, quantifiable edge. Instead of making emotionally driven decisions based on what you think the market is doing, you're making data-driven choices.
This aligns perfectly with the principles of systematic and algorithmic trading:
Risk Management: Volatility is directly proportional to risk. By understanding it, you can dynamically adjust your position size and stop-losses, preventing devastating drawdowns.
Strategy Adaptation: No single strategy works in all market conditions. These filters can tell you when to execute a breakout strategy versus a mean-reversion strategy. This adaptability is what makes them valuable.
Pattern Recognition: Volatility often contracts before an expansion (think Bollinger Band Squeeze) or spikes at market turning points. These filters help you identify these crucial patterns.
Curiosity Gap & FOMO: The insights provided by these filters reveal a deeper layer of market mechanics that many retail traders simply miss, creating a "fear of missing out" on a true understanding of market dynamics.
Variations & Robustness: Taking it to the Next Level
Once you understand these core filters, you can experiment with:
Timeframes: Apply them to different timeframes (daily, weekly, hourly) to understand multi-scale volatility.
Parameter Optimization: Test different lookback periods (10-period ATR vs. 20-period ATR) to see what works best for specific assets.
Combinations: Combine filters (Bollinger Bandwidth with ATR) for more unique signals.
Regime Analysis: Use volatility filters to define distinct market regimes and then backtest your strategies within those specific regimes. For example, back test your trend-following strategy only during high-volatility, trending periods identified by ATR or Donchian Channels.
Takeaways & Next Steps
Volatility is Key: It's not just about predicting direction; it's about understanding the energy of the market.
Quantify Everything: Use these 10 filters to objectively measure market volatility.
Adapt Your Approach: Use volatility signals to dynamically adjust your trading strategies and risk management.
No More Guessing: Make data-driven decisions that elevate your trading from an art to a science.
Automate and Backtest: Integrate these filters into your systematic or algorithmic workflows.
What should you test next? Pick one or two of these filters that resonate most with your current strategies. Start by simply adding them to your charts and observing how they behave in real-time.
Then, consider how you might build simple rules around them:
As an example: "Only take long trades if ATR is above X" or "Only trade if Bollinger Bands are contracting."
Don't Get Left Behind. Level Up Your Trading.
The information outlined here is just the tip of the iceberg. True mastery comes from consistent application and deeper exploration. If you're serious about taking your trading to the next level, understanding and implementing dynamic volatility is non-negotiable.
Are you missing mean-reversion strategies in your portfolio?
I recently shared the exact strategies I trade in my multi-strategy portfolio, and it's backtested for over 25 years and 2+ years live traded.
Click here to get my strategies now on AlgomaticTrading.com!
Educational content only. Nothing here is financial advice.
Molto interessante ed efficace ! Grazie
Great breakdown of volatility filters, I really enjoyed how you laid out the practical uses of each one. In your experience, which of these filters tends to add the most edge when markets shift rapidly between low and high volatility regimes?